Overview
The primary method of sample data visualization is through Control Charts. However, the SPC module may also be used simply for its capability to schedule when samples are taken for quality checks and it may be that a simple tabular report of the quality checks is all that needs to be shown. This kb shows how to access the sample data through scripting that can then be served up in tabular format.
Applies To and Version Info
This feature applies to the SPC 3.8x module versions.
Details
Displaying raw SPC data can be accomplished using the standard Analysis tools:
- Analysis Selector
- Analysis Controller
- Analysis Scripting Functions
Components:
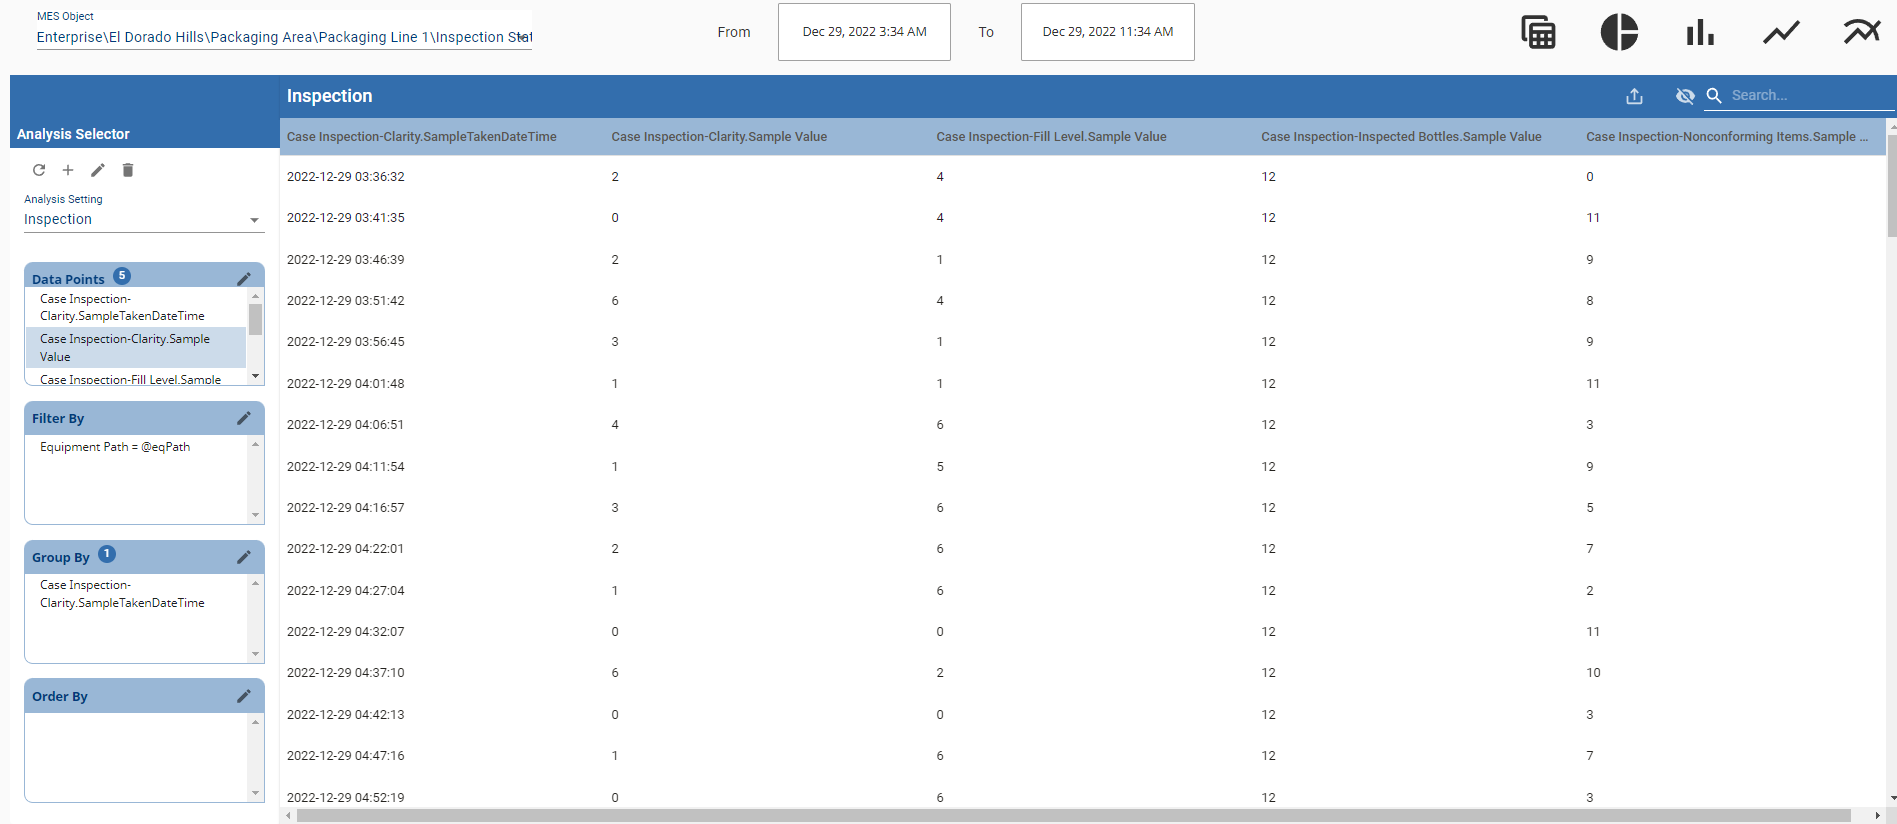
Using the Analysis Selector, we can create an analysis setting that can be used as ad hoc reporting, a source for an analysis controller, or a saved setting to recall via script.
In this example, we have a Sample Definition called Cased Inspection with several attributes we have been sampling against (Clarity, Fill Level, Inspected Bottles, and Nonconforming Items).
We want to display the measurement results in a table for some time frame.
Using the Analysis Selector, Find the data points SPC section and drill into the Sample Definition and Attribute desired:
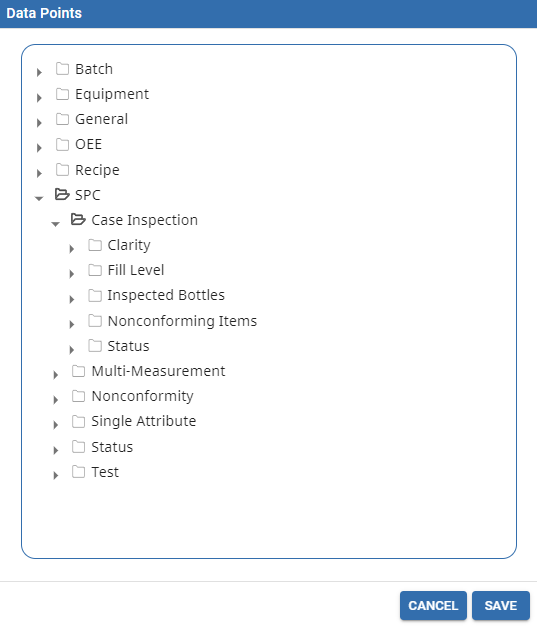
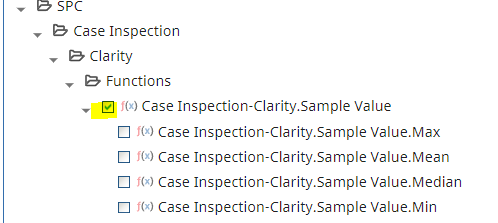
There are many data points but for now we will select the Sample Value to get the original, raw sample value.
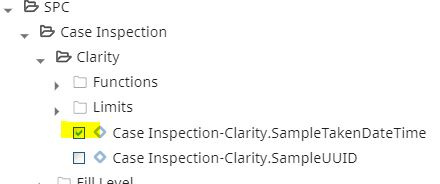
In my sample process, I collect all the samples as part of the same sample so any of the attribute SampleTakenDateTime values will be the same for this sample group. Here I'll select any of the attributes SampleTakenDateTime data point.
Once I have all the other Attribute values selected, I will save. Here I will group by a filter param called eqPath which is bound to an MES Object Selector:
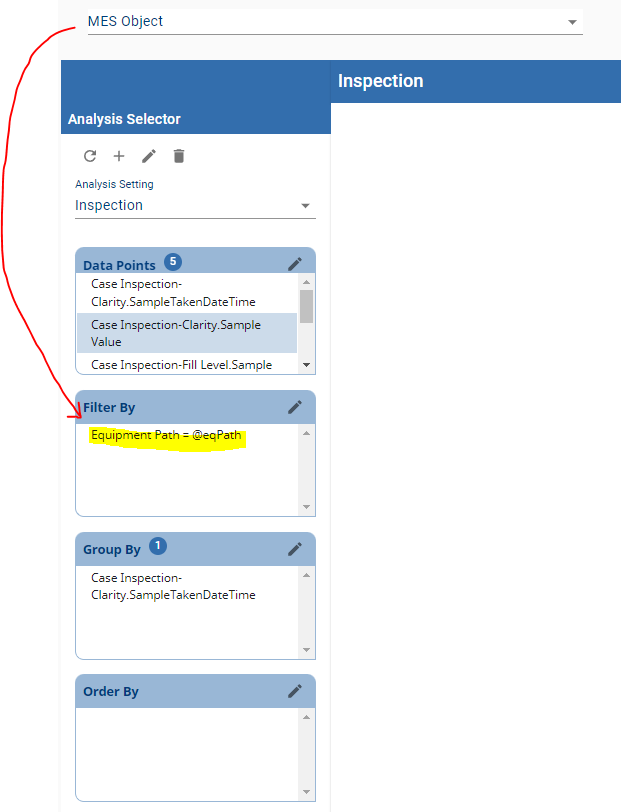
Group By the SampleTakenDateTime data point to get a unique row for each.
After a Location and Begin and End Timestamps are provided, execute your analysis.
You should have the data in tabular format: