Using VisualVM for Java Performance Troubleshooting
Introduction: Identifying Performance Bottlenecks
When diagnosing the root cause of performance issues in a Java application, one of the most effective free utilities available is VisualVM. This powerful tool allows you to profile an application's CPU usage and memory allocation, providing deep insights into its behavior and helping to pinpoint specific bottlenecks. This guide provides a step-by-step process for setting up VisualVM and using it to profile both client and gateway Java processes. To begin, you must first properly configure your environment and the target application.
Prerequisites and Initial Setup
Proper setup is a critical first step in the troubleshooting process. These initial configuration steps ensure that VisualVM can correctly connect to, monitor, and collect performance data from the target Java application. Without this configuration, VisualVM cannot identify or access the target application.
Install VisualVM
- Download the standalone version of VisualVM from the official site:
https://visualvm.github.io/.
- Extract the contents of the downloaded ZIP archive to a location on your local machine.
- The main executable file is located within the extracted folder at
/bin/visualvm.exe.
- You must install VisualVM on the same machine as the application you are profiling (either the client or the gateway).
Gateway Configuration for JMX Monitoring
To profile the gateway, you must enable Java Management Extensions (JMX), Java's built-in framework for managing and monitoring applications. This framework is what allows an external tool like VisualVM to connect securely to the gateway's Java Virtual Machine (JVM).
These properties must be passed to the Gateway's Java Virtual Machine (JVM). Add the following lines to
/data/ignition.conf, ensuring the numbers (.7, .8, etc.) are sequential and do not conflict with existing entries.wrapper.java.additional.7=-Dcom.sun.management.jmxremote
wrapper.java.additional.8=-Dcom.sun.management.jmxremote.port=9010
wrapper.java.additional.9=-Dcom.sun.management.jmxremote.rmi.port=9010
wrapper.java.additional.10=-Dcom.sun.management.jmxremote.local.only=true
wrapper.java.additional.11=-Dcom.sun.management.jmxremote.authenticate=false
wrapper.java.additional.12=-Djava.rmi.server.hostname=
wrapper.java.additional.13=-Dcom.sun.management.jmxremote.ssl=false After modifying the
ignition.conf file, a gateway restart is mandatory for the changes to take effect.With the necessary setup and configuration complete, you are now ready to launch VisualVM and begin the profiling process.
Procedure: Profiling an Application
This section covers the active profiling stage, from launching the VisualVM application and connecting to the target Java process to initiating the CPU sampling that gathers the necessary performance data. Following these steps will allow you to capture a detailed snapshot of the application's behavior during the problematic operation.
Launching VisualVM and Connecting to a Process
First, open the VisualVM application using the
/bin/visualvm.exe executable from the installation directory.Identifying the Target Process
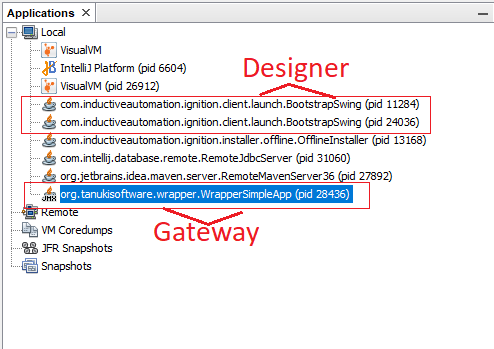
Once launched, VisualVM will display a list of local Java applications. You can identify the specific process you need to profile based on its name:
- Gateway Process: The process name will end with
WrapperSimpleApp.
- Designer/Client Process: The process name will end with
BootstrapSwing.
Connecting to the Process
The method for connecting to the target process varies depending on its type.
- For the Client or Designer: The process should appear automatically in the "Local" applications list. No additional steps are required to establish the initial connection.
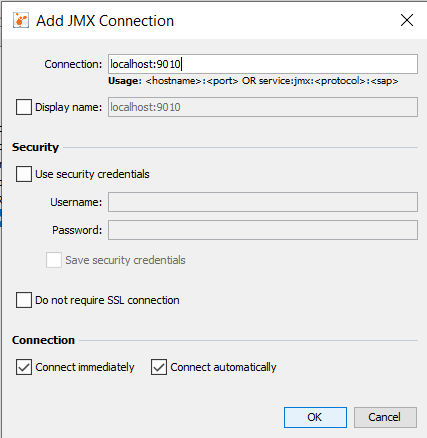
- For the Gateway: You must connect manually using the JMX port configured earlier.
- Navigate to the menu bar and select
File > Add JMX Connection.
- In the connection dialog, enter
localhost:9010, using the port (9010) that was defined in theignition.conffile.
After the process is listed correctly, double-click its entry to open its main monitoring dashboard.
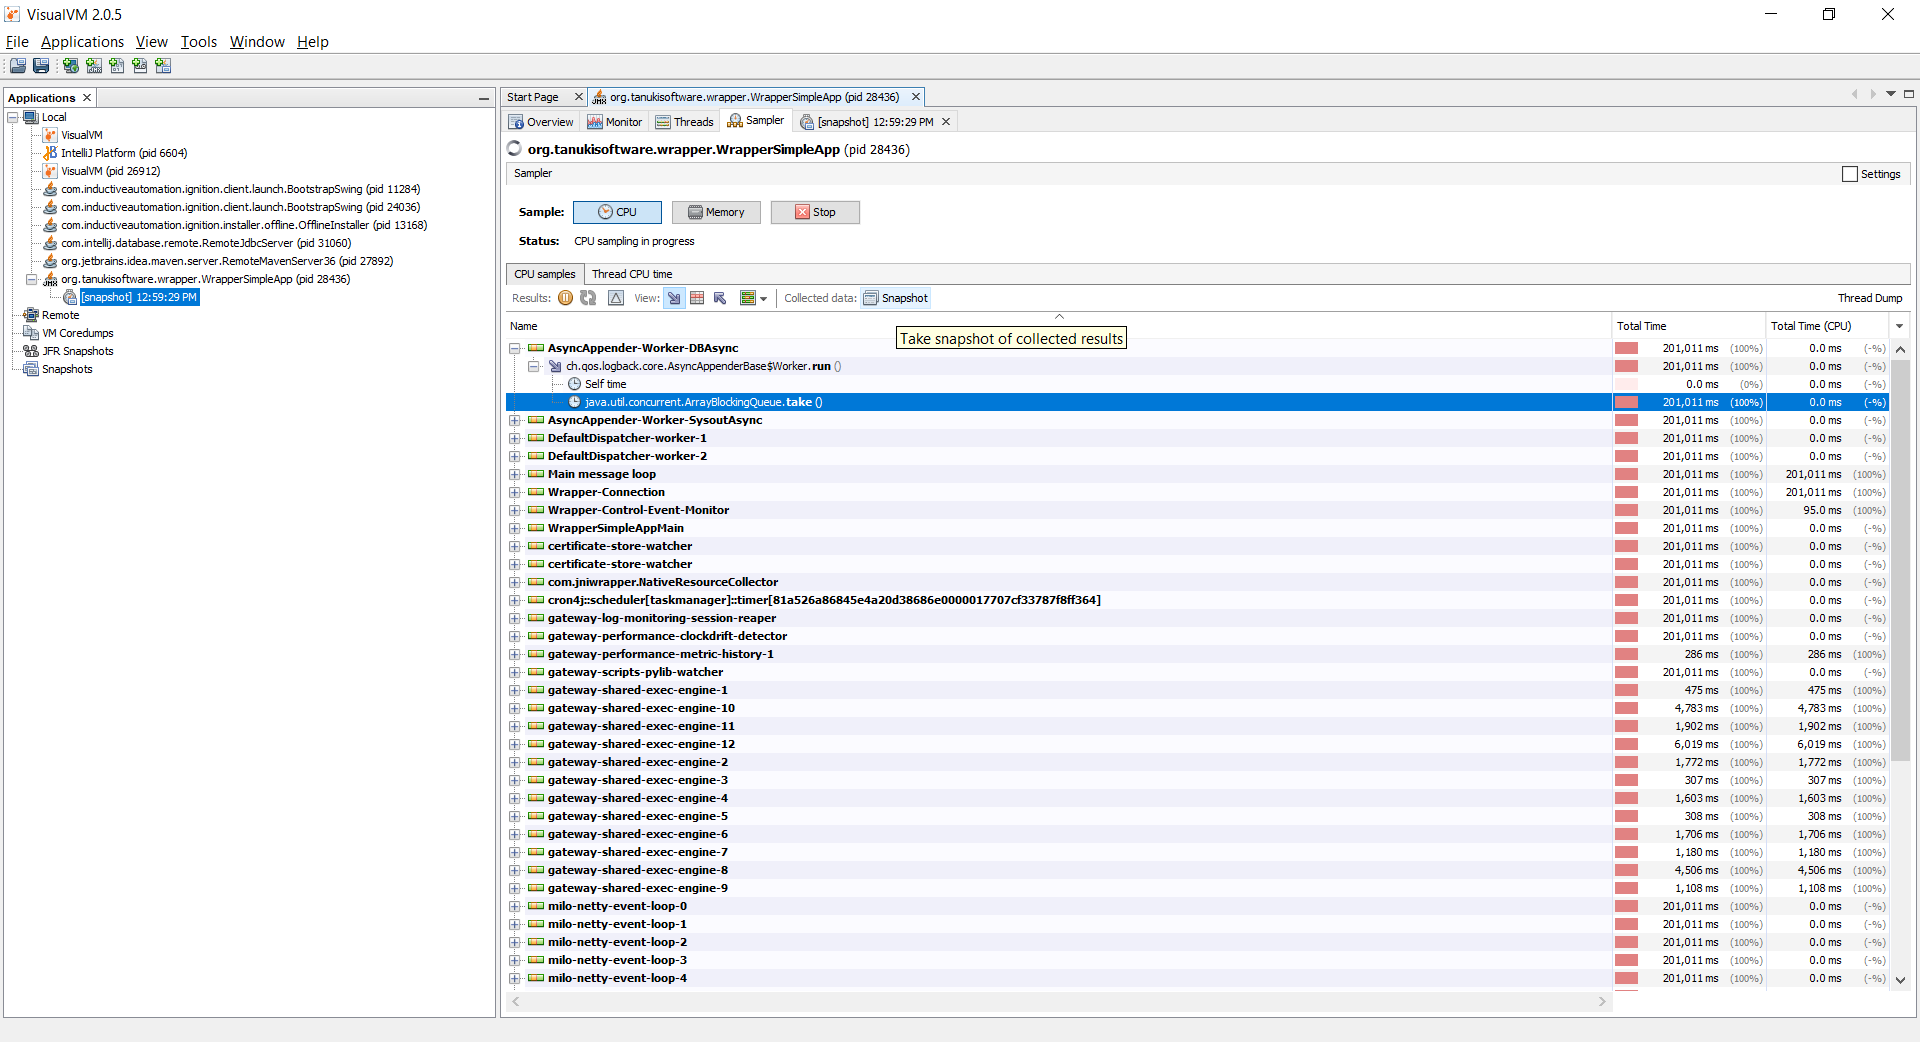
Performing CPU Sampling
- With the connection established, you can now capture performance data using the CPU sampler.
- In the process dashboard, navigate to the Sampler tab.
- Click the CPU button to begin the sampling session.
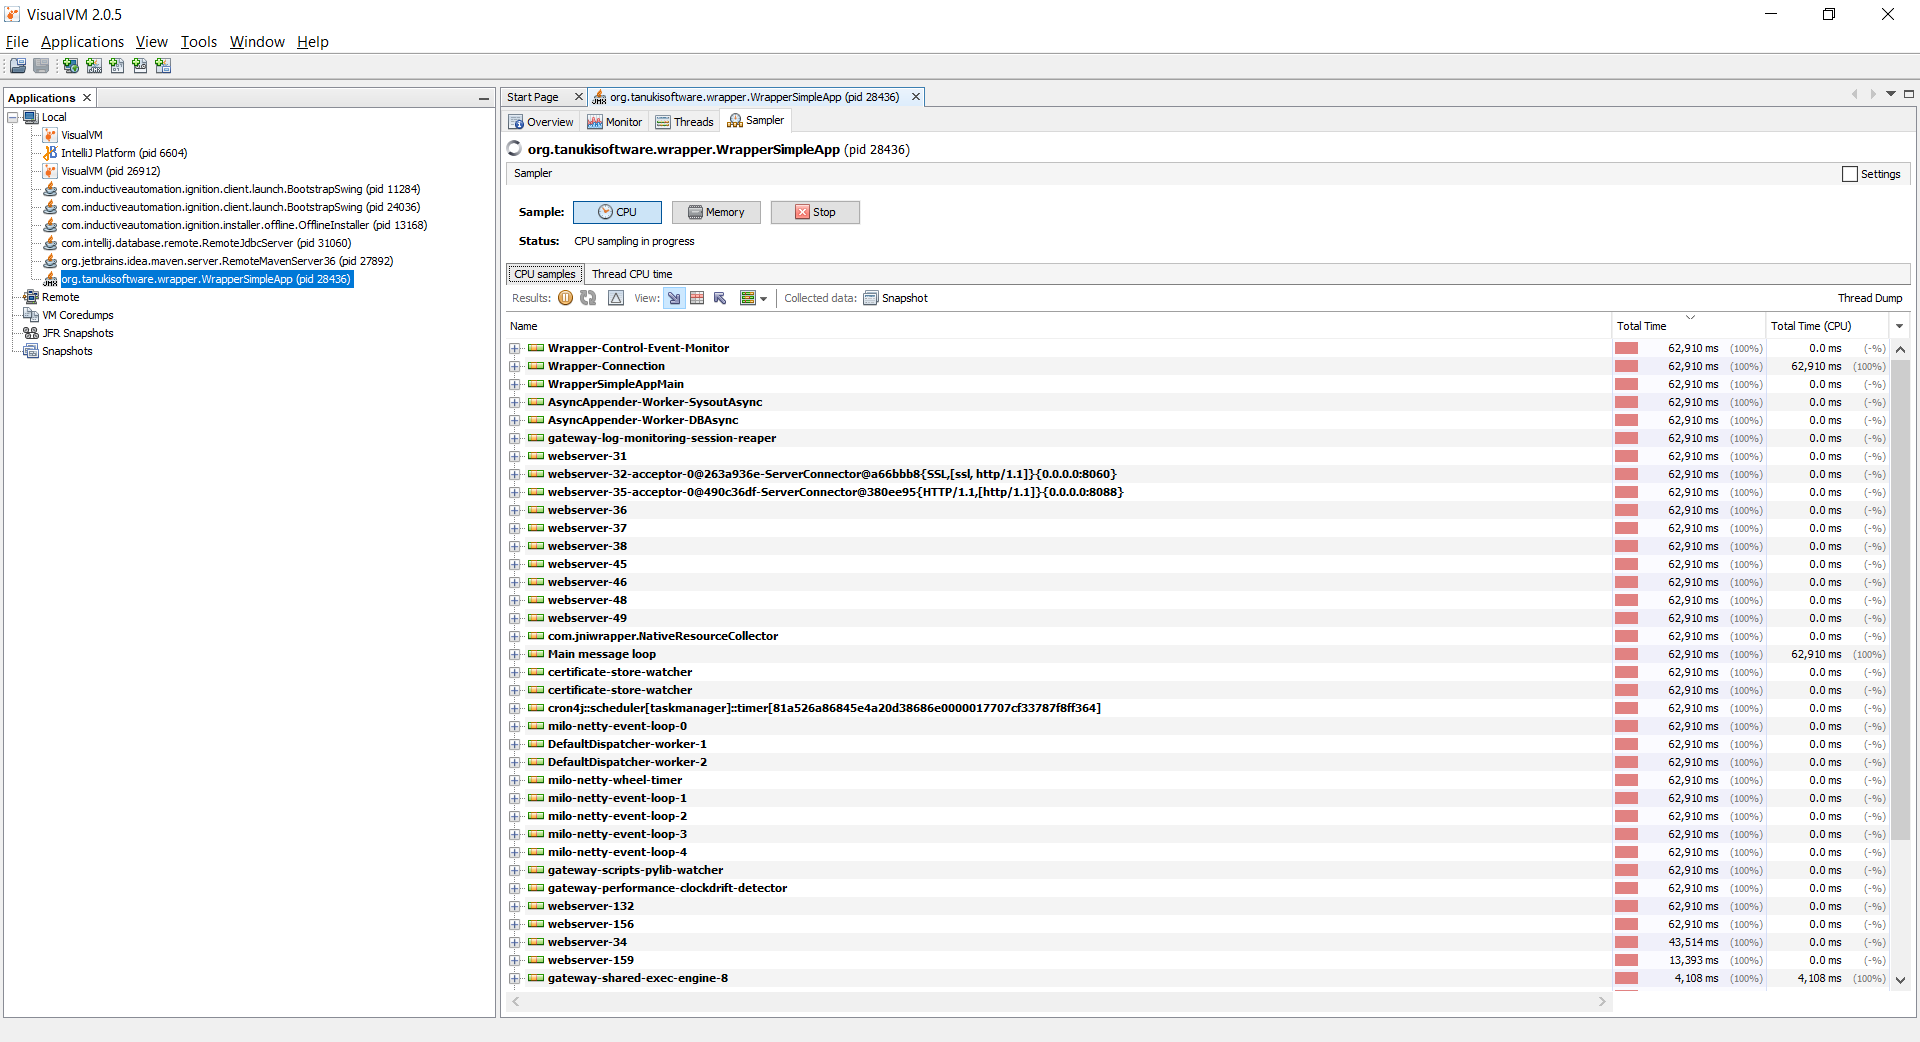
- Crucially, you must perform the specific action that is causing slow performance while sampling is active. The goal is to capture a representative slice of the application's behavior during the performance issue. Sampling for 30-60 seconds while you reproduce the slow action is often sufficient to gather meaningful data.
- After running the slow action and allowing sufficient time for data collection, click the Snapshot button. This stops the sampling and generates a detailed performance snapshot from the collected data.
Once the snapshot is generated, the final step is to save it for further analysis.
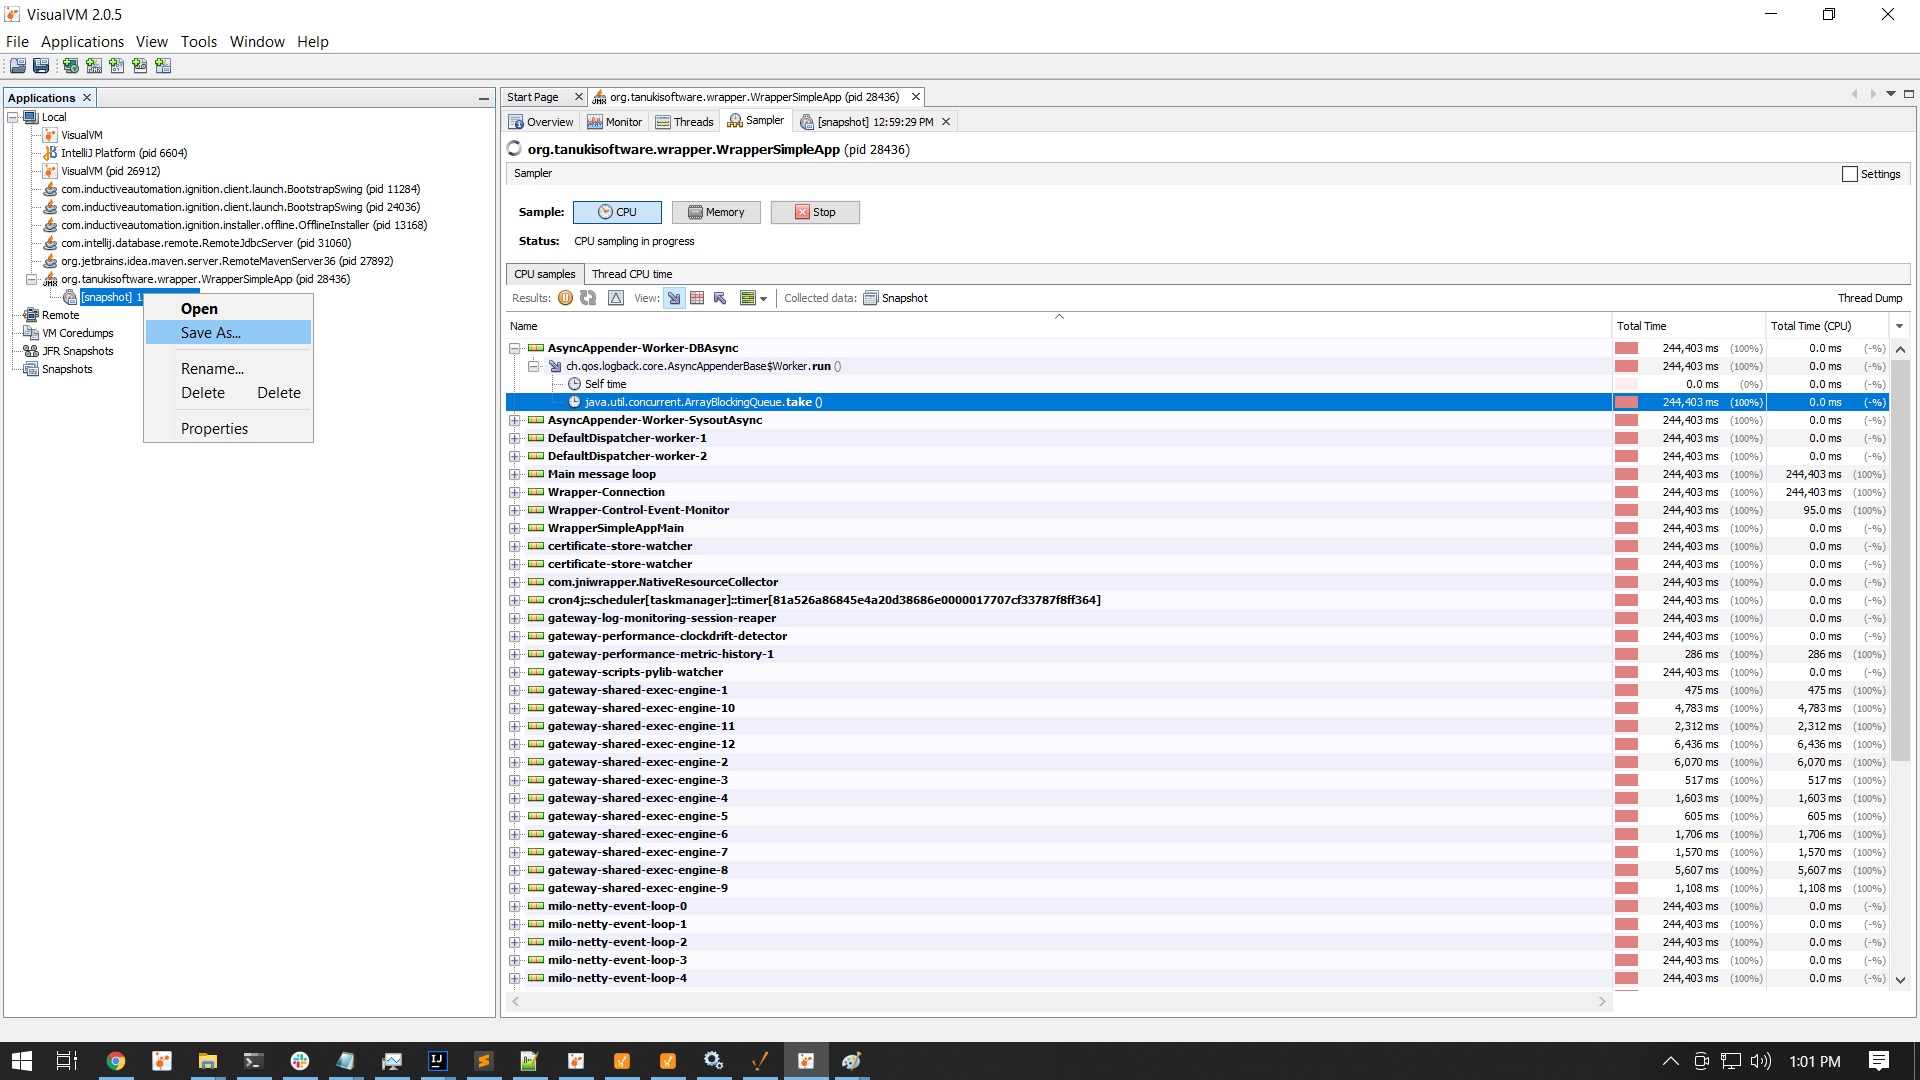
- Finalizing and Exporting the Snapshot
The data collected during the CPU sampling session is stored in a snapshot within the VisualVM interface. To share this data with a developer for analysis, you must save it as a portable file. The
.nps snapshot is a self-contained file that a developer can load into their own VisualVM instance, exactly as if they had captured it themselves.- After you click the 'Snapshot' button, a new item representing the captured data will appear in the application tree on the left-hand side, nested under the process you were profiling.
- Right-click on this new snapshot item.
- From the context menu, select the 'Save As...' option.
- This action creates a
.npsfile on your local system.
- This
.npsfile contains the detailed CPU profiling data required for an in-depth performance investigation and is the final asset that should be provided to a developer for analysis.