View OEE Data on Dashboard
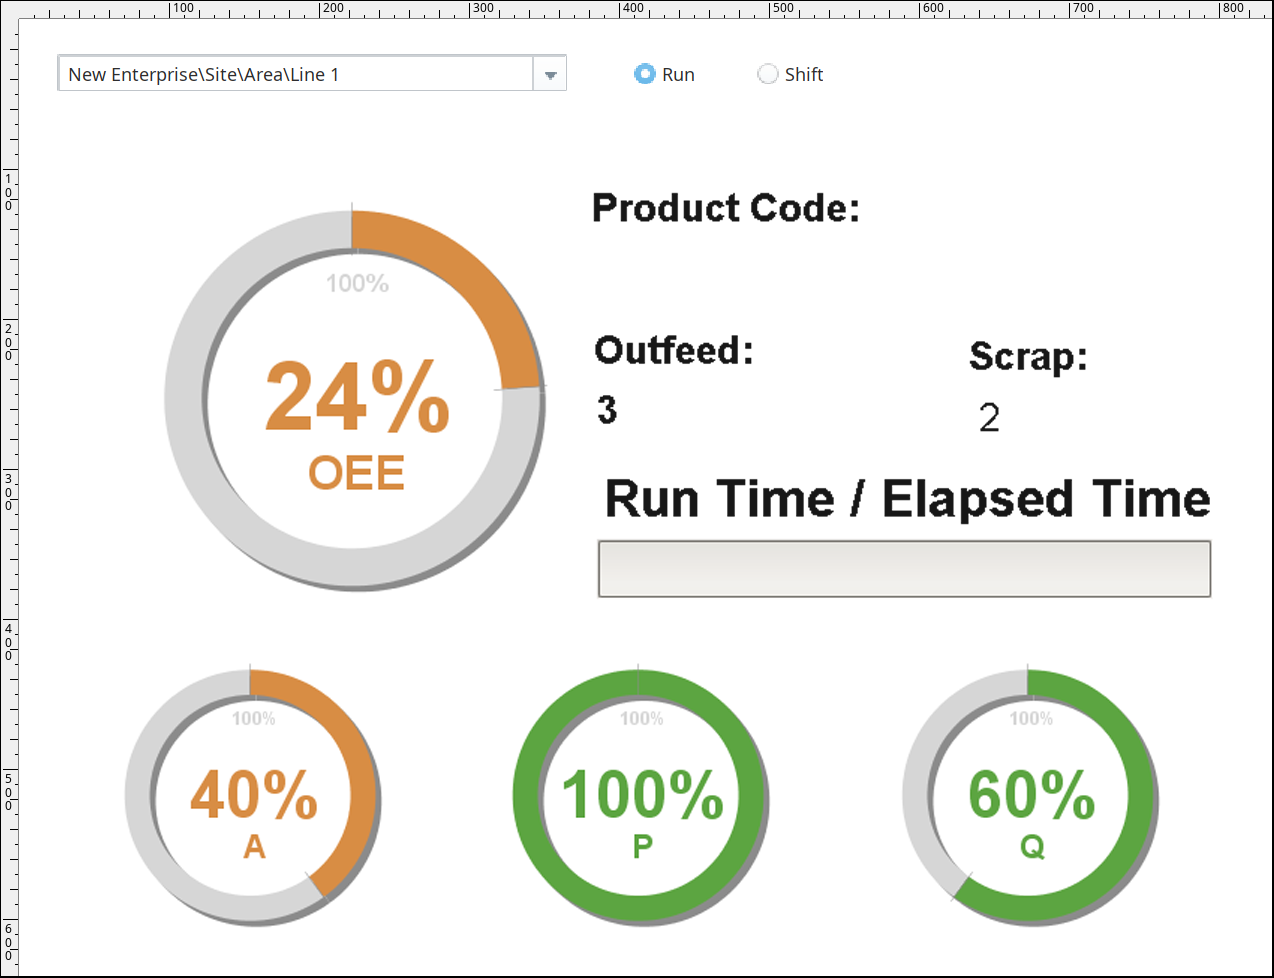
- In Preview mode, select the Run radio button.
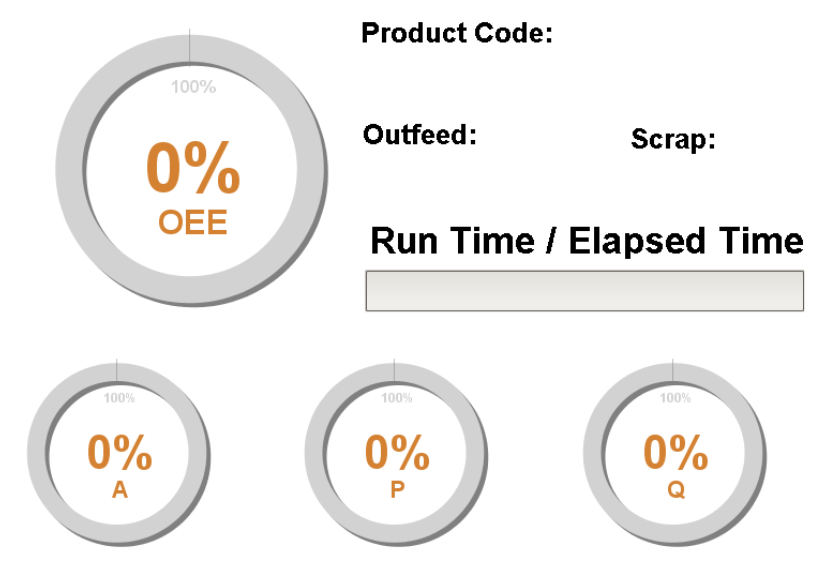
Select New Enterprise\Site\Area\Line 1 from the MES Object Selector.

The dials should go from red (configuration or no-data error) to all zeros because you haven't done any runs after creating the Run and Shift Live Analysis for each Line (no OEE history collected yet).
- Using the 02_Production Control screen and the Line 1 Memory Tags for Cell A and Cell B again, simulate additional production runs that include successful units, rejected units, as well Equipment Mode changes.
- Use the MES Value Editor on the 03_Analysis screen to confirm that value collection occurred properly.
Confirm OEE and other calculated data appears as expected on the 'Dashboard' dials on the 04_Reporting screen for run and shift (choose using the Run and Shift radio buttons).
OEE calculations on the dials may exceed 100%, since both the OEE Schedule Rate and the OEE Standard Rate default values are 100 units per hour. When you increment the production counters manually, you are likely 'producing' units much faster than the default rate.
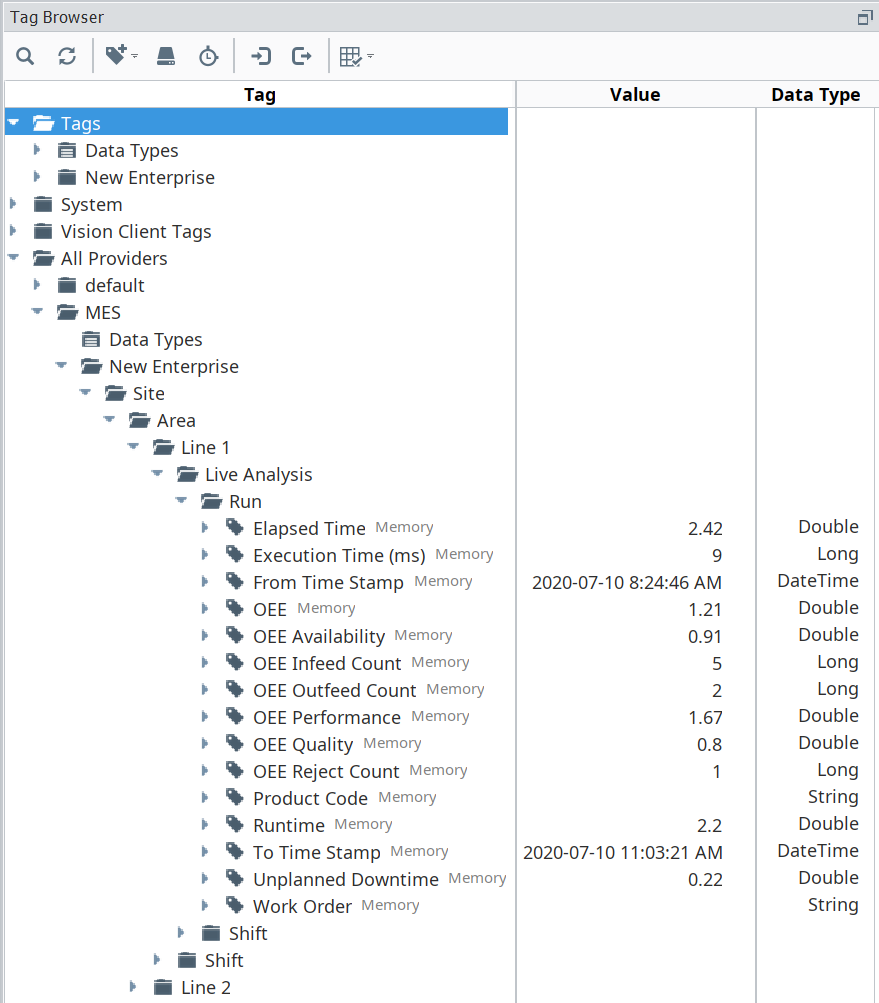
You can also view Live Analysis tag collection in real time in the Tag Browser, under All Providers → MES. These Tags are created automatically when you create a Live Analysis. Drill down to the Run and Shift folders for each Line and view the tags directly, as shown to the right.
Change the MES Object Selector to Line 2. The dials should all be at 0%. Perform a simulated production run on Line 2. Verify that OEE is now displayed properly on the dials.
Example Live Analysis results (Line 1 shown):
Dashboards can be configured using Live Analysis to quickly scale dashboarding and live reporting needs. Determine what information is most important for your use case or customer and consider either adding it to your current template, or create a new one.