Sepasoft MES Module Suite
MES Monitor Component | Vision
This component displays statistics about operations on each server in the Enterprise. It can be used to measure from either server boot-up or a reset point, or across a specified time period. Timers and counters are provided, to support quantifying measurements and debugging activities. Tags are created for various metrics, to allow live monitoring and control via Ignition components, MES components, and scripts.
This component can be found on the Production component palette and is installed with the production-module.modl which is licensed with all MES modules.
MES Monitor interface
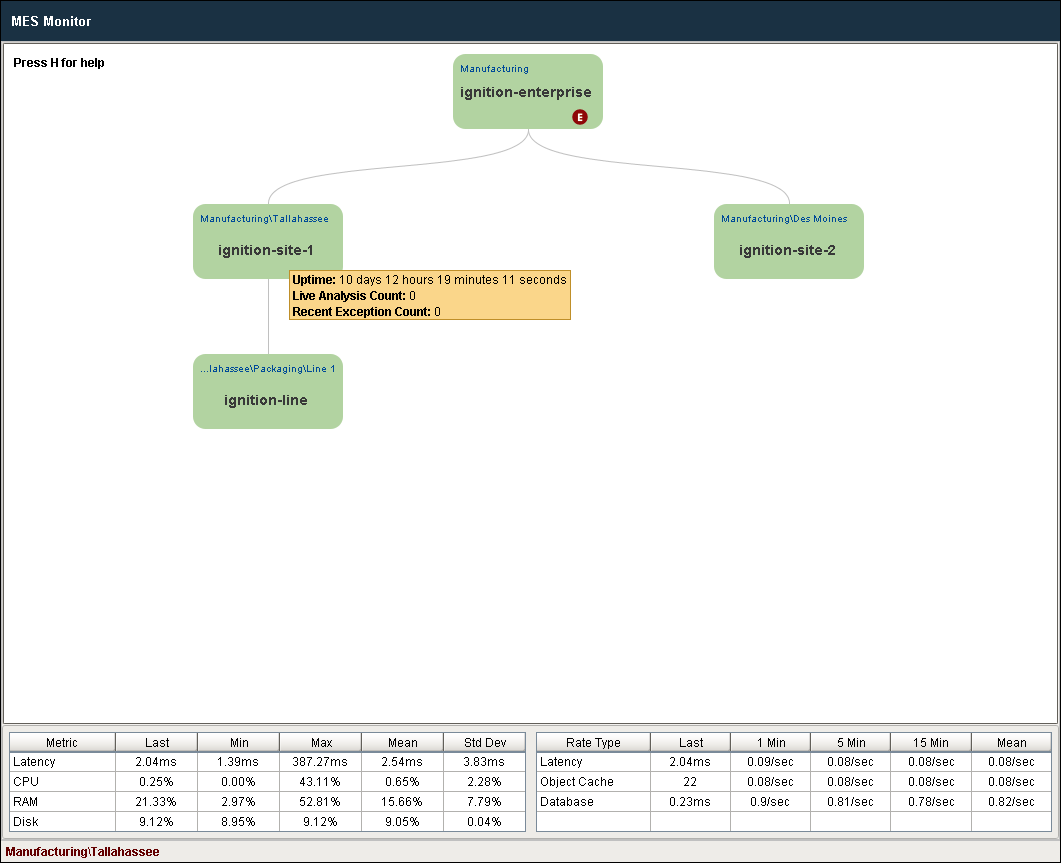
Main View
The Main View graphically displays the current system-wide server architecture and interconnections, from the main Enterprise-level server displayed at the top downward to individual Site servers and Line servers (if present).
The graphical display can be manipulated with various mouse actions (refer to the Help section below).
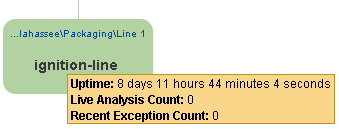
Hovering over any server in the Main View brings up basic server information in a tool tip box (see image below):
- Uptime – Total time since the server was started or rebooted.
- Live Analysis Count – Total number of Live Analyses currently running on the server.
- Recent Exception Count – The total number of exceptions that have occurred on the server since metrics were started or reset.
MES Monitor Tags
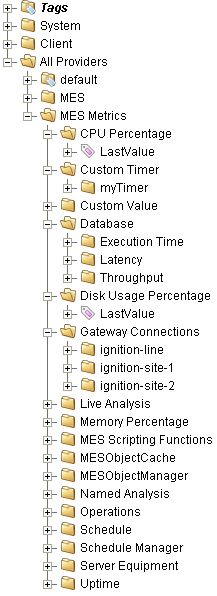
Metrics Table
When hovering the mouse over a server in the Main View, data related to that server appears in the Metrics Table.

Data displayed in the Metrics Table:
| Latency | Latency (delay between initiating a database change or query and it actually starting) on this server since metrics were started or reset. Last, Minimum, Maximum, Mean and Standard Deviation numbers are displayed. |
| CPU | Percentage of CPU processing bandwidth usage on this server since metrics were started or reset. Last, Minimum, Maximum, Mean and Standard Deviation numbers are displayed. |
| RAM | Percentage of RAM in use on this server since metrics were started or reset. Last, Minimum, Maximum, Mean and Standard Deviation numbers are displayed. |
| Disk | Percentage of disk space in use on this server since metrics were started or reset. Last, Minimum, Maximum, Mean and Standard Deviation numbers are displayed. |
Rate Type |
|
| Latency | The time in milliseconds it takes to send an empty message to and back from that gateway. |
| Object Cache | How many objects are currently stored in memory in the MES Object Cache on that gateway. |
| Database | The time in milliseconds it takes to get a connection to the Analysis database on that gateway. |
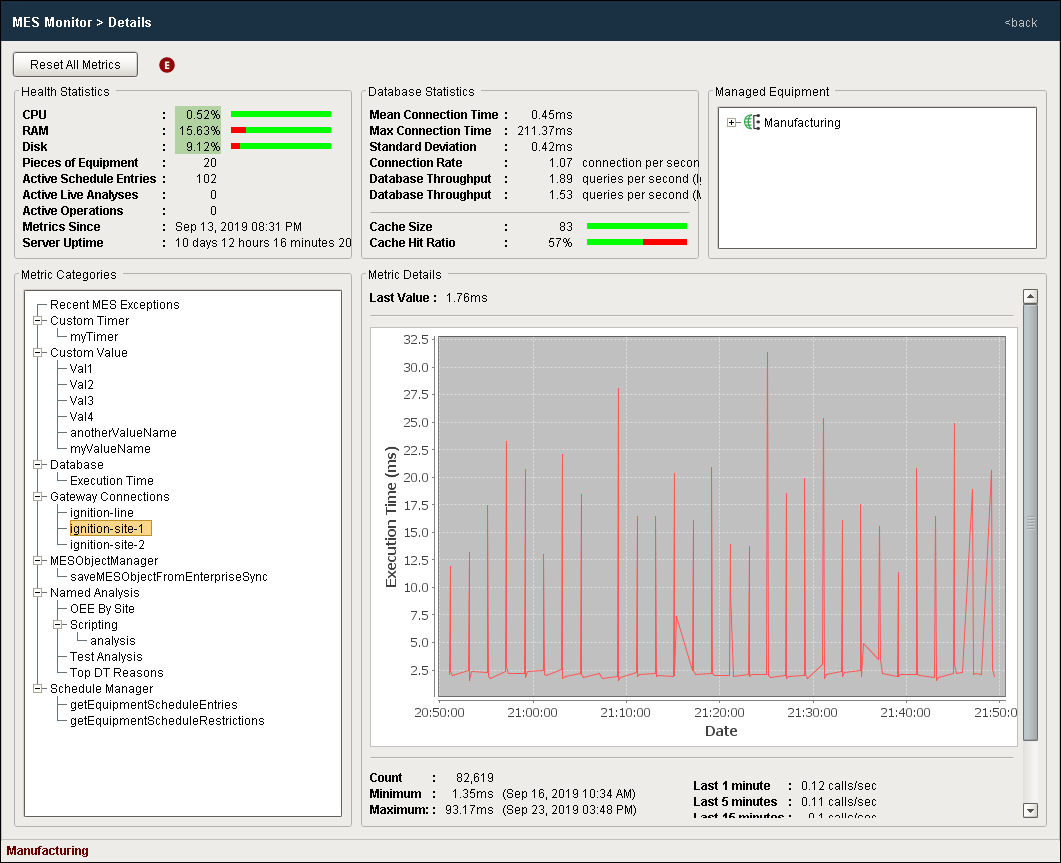
The following sections describe the various sections and data-display options on the Details View:
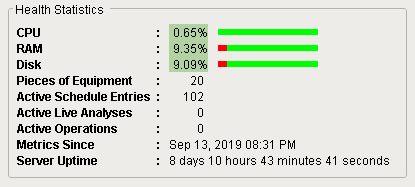
Health Statistics
Data displayed in the Health Statistics area:
| CPU | Current percentage of CPU processing bandwidth usage on this server. |
| RAM | Current percentage of RAM in use on this server. |
| Disk | Current percentage of disk space in use on this server. |
| Pieces of Equipment | Number of Equipment Items managed by the server. |
| Active Schedule Entries | Number of MES schedules either currently in process or scheduled for the future on this server. |
| Active Live Analyses | Number of Live Analyses currently running on this server. |
| Active Operations | Number of operations currently running (Operations Response Segments active) on this server. |
| Metrics Since | When the metrics started or were last reset. |
| Server Uptime | How long this server has been running since its last boot-up or reboot. |
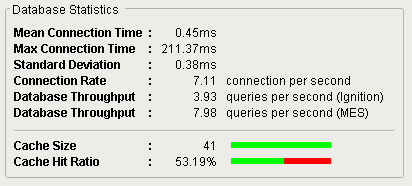
Database Statistics
Data displayed in the Database Statistics area:
| Mean Connection Time | Mean time to complete a database transaction on this server since metrics were started or reset. |
| Max Connection Time | Maximum time to complete a database transaction on this server since metrics were started or reset. |
| Standard Deviation | Difference in connection times one sigma faster or slower than the Mean Connection time on this server, since metrics were started or reset. |
| Connection Rate | Average number of database connections per second on this server since metrics were started or reset. |
| Database Throughput (Ignition) | Average number of database Ignition-related queries per second on this server since metrics were started or reset. |
| Database Throughput (MES) | Average number of database MES-related queries per second on this server since metrics were started or reset. |
| Cache Size | Database cache size currently in use (Mbytes). |
| Cache Hit Ratio | Ratio of cache re-uses (hits) versus fresh database queries. |
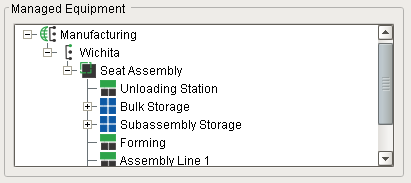
Managed Equipment
This pane displays a hierarchy tree of the Equipment Items created on this server. It is provided for reference only. No actions occur by clicking on the items.
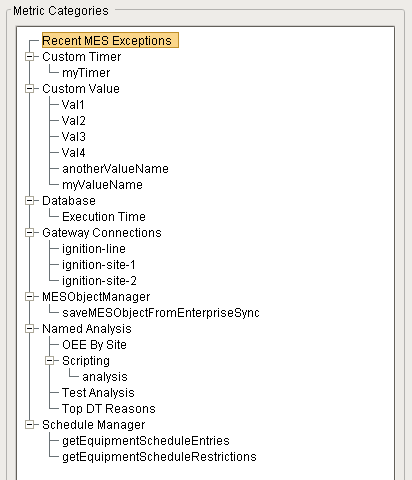
Metric Categories and Metric Details
This pane displays various metric categories and their related entities:
- MES exceptions
- Custom timers
- Custom values
- Database accesses
- Gateway connections
- MES Object Manager activity
- Analyses (named and unnamed)
- Scripted analyses (named and unnamed)
- Live Analyses
- MES Schedule Manager activity

|
Categories for which no entities exist on this server will not be shown in the Metric Categories list. |
Recent MES Exceptions
This metric category displays the Ignition and MES exceptions that have occurred on this server since metrics were started or reset.
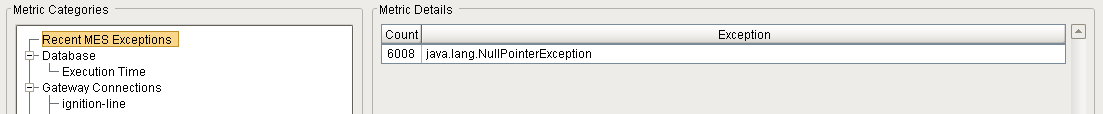
Data displayed in Metric Details section for the Database selection:
| Name | Description |
|---|---|
| Count | This column shows the total of each type of exception listed in the Exception column that occurred on this server since metrics were started or reset. |
| Exception | This column lists all of the different types of exceptions that occurred on this server since metrics were started or reset. |
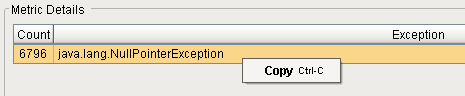
Copy Exception Row
Right-clicking anywhere on an exception row brings up the Copy function. Click it to copy the description text to the clipboard (example: "java.lang.NullPointerException").
You can also copy by clicking to highlight a row and using Ctrl-C.
Database
This metric category displays information about MES database accesses.
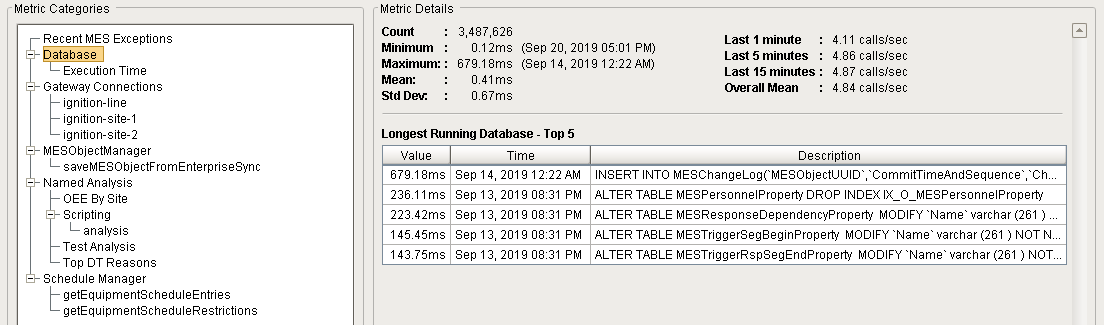
Data displayed in Metric Details section for the Database selection:
| Name | Description |
|---|---|
| Count | Total number of database changes or queries on this server since metrics were started or reset. |
| Minimum | Fastest (minimum) connection time for a database change or query on this server since metrics were started or reset. |
| Maximum | Slowest (maximum) connection time for a database change or query on this server since metrics were started or reset. |
| Mean | Mean connection time for all database changes and queries on this server since metrics were started or reset. |
| Std Dev | The time for one sigma of standard deviation of variation in connection times for all database changes and queries on this server since metrics were started or reset. |
| Last 1 minute | The number of database access calls on this server over the last 1 minute (or since since metrics were started or reset, if less than 1 minute). |
| Last 5 minutes | The number of database access calls on this server over the last 5 minutes (or since since metrics were started or reset, if less than 5 minutes). |
| Last 15 minute | The number of database access calls on this server over the last 15 minutes (or since since metrics were started or reset, if less than 15 minutes). |
| Overall Mean | The mean number of database access calls on this server since metrics were started or reset. |
| (list of exceptions) |
Ignition-based code exceptions on this server since metrics were started or reset.
If none, the message displayed is "No recent exceptions". |
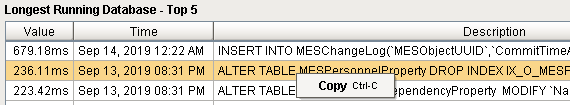
| Longest Running Database - Top 5 | Table of the top 5 longest-running database access calls on this server since metrics were started or reset. |
Copy Database Access Row
Right-clicking anywhere on an MES database access row brings up the Copy function. Click it to copy the description text to the clipboard (example: "ALTER TABLE MESPersonnelProperty DROP INDEX IX_O_MESPersonnelProperty").
You can also copy by clicking to highlight a row and using Ctrl-C.
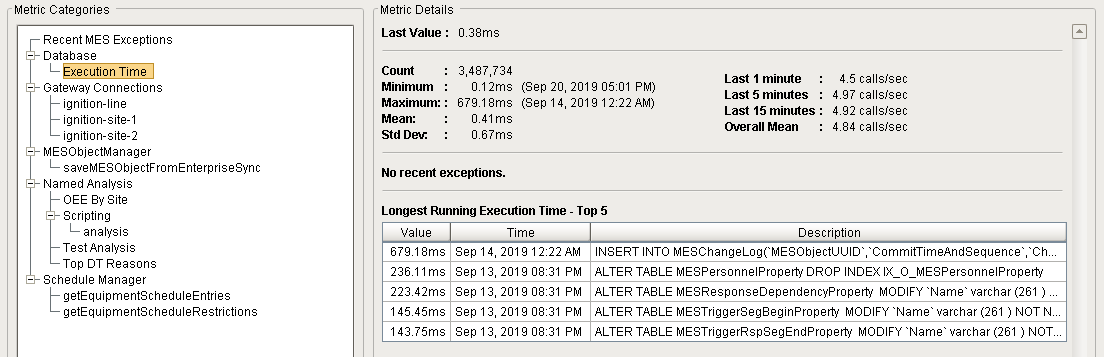
Database - Execution Time
This metric category displays all the same information as the Database selection (see above), but also includes a Last Value metric.
| Name | Description |
|---|---|
| Last Value | The connection time for the last database change or query completed on this server at the time that Execution Time was selected in the Metric Categories pane. |
| (other metrics) | Same as Database section above. |
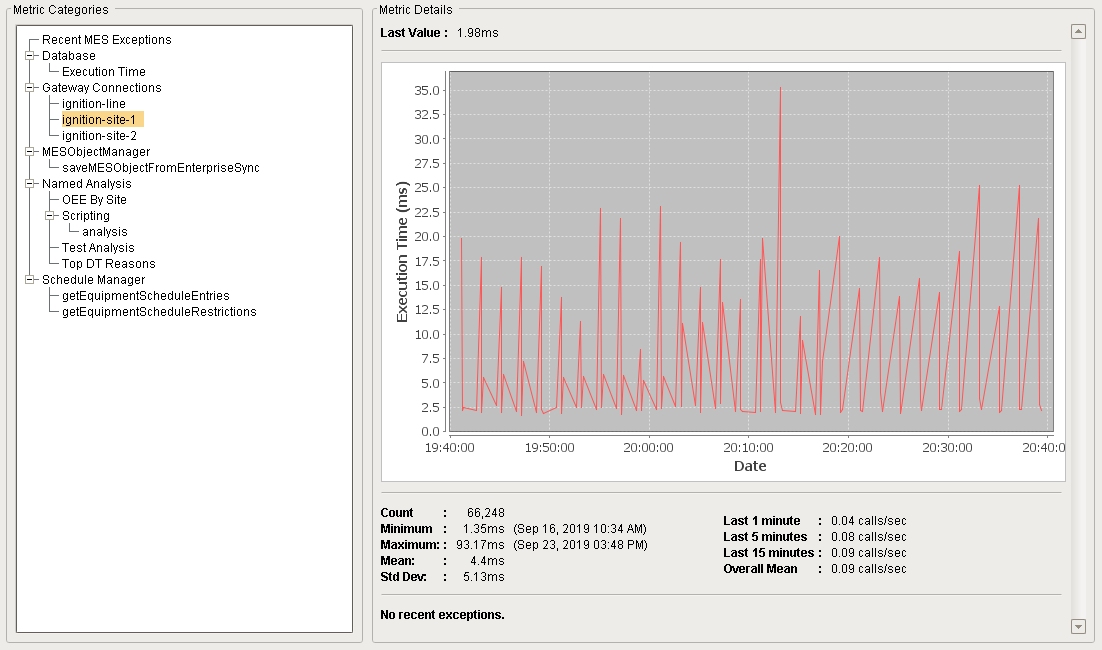
Gateway Connections
This metric category displays information about gateway connections.
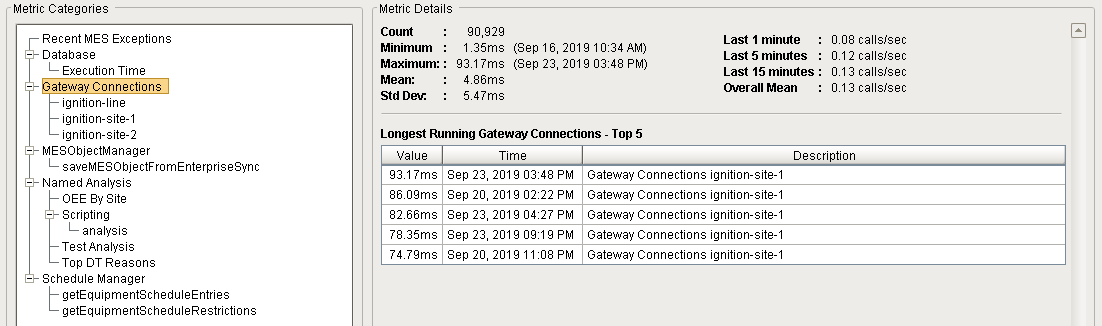
Data displayed in Metric Details section for the Gateway Connections selection:
| Name | Description |
|---|---|
| Count | Total number of gateway connections on this server since metrics were started or reset. |
| Minimum | Fastest (minimum) connection time for a gateway connection on this server since metrics were started or reset. |
| Maximum | Slowest (maximum) connection time for a gateway connection on this server since metrics were started or reset. |
| Mean | Mean connection time for all gateway connections on this server since metrics were started or reset. |
| Std Dev | The time for one sigma of standard deviation of variation in connection times for all gateway connections on this server since metrics were started or reset. |
| Last 1 minute | The number of gateway connection calls on this server over the last 1 minute (or since since metrics were started or reset, if less than 1 minute). |
| Last 5 minutes | The number of gateway connection calls on this server over the last 5 minutes (or since since metrics were started or reset, if less than 5 minutes). |
| Last 15 minute | The number of gateway connection calls on this server over the last 15 minutes (or since since metrics were started or reset, if less than 15 minutes). |
| Overall Mean | The mean number of gateway connection calls on this server since metrics were started or reset. |
| (list of exceptions) |
Ignition-based exceptions on this server since metrics were started or reset.
If none, the message displayed is "No recent exceptions". |
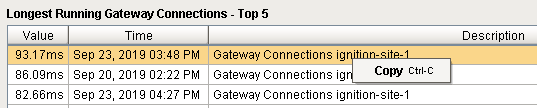
| Longest Running Gateway Connections - Top 5 | Table of the top 5 longest-running gateway connection calls on this server since metrics were started or reset. |
Copy Gateway Connection Row
Right-clicking anywhere on a gateway connection row brings up the Copy function. Click it to copy the description text to the clipboard (example: "Gateway Connections ignition-site-1").
You can also copy by clicking to highlight a row and using Ctrl-C.
Gateway Connections - (Site)
This metric category displays information about gateway connections for the selected Site. It has all the same information as the Gateway Connections selection (see above), but also includes a Last Value metric and a graph of execution times for the selected Site on this server since metrics were started or reset.
| Name | Description |
|---|---|
| Last Value | The connection time for the last gateway connection completed for the selected Site on this server at the time that the Site was selected in the Metric Categories pane. |
| (other metrics) | Same as Gateway Connections section above. |
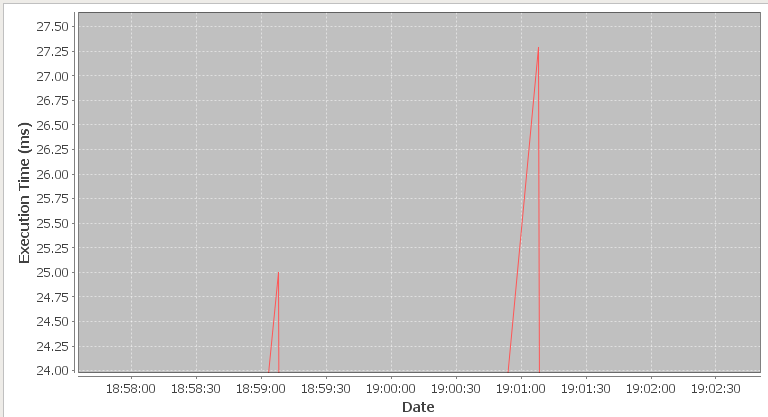
Execution Times Graph
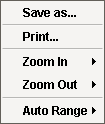
A graph displays the execution times for the selected Site on this server since metrics were started or reset. Various display functions are available:
| Mouse Action | Functionality |
|---|---|
| Left-click and drag downward to the right |
Zooms the graph in to the area enclosed by the dragged box. Note that this function zooms in both the X and Y axes simultaneously.
|
| Left-click and drag to the left | Resets the graph to cover the entire time span since metrics were started or reset. |
|
Right click (pop-up menu)
|
|

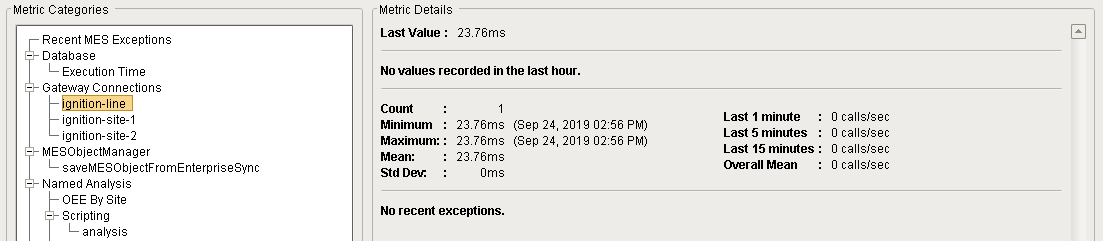
Gateway Connections - (Line)
This metric category displays information about gateway connections for the selected Line. It has all the same information metric fields as the Gateway Connections - (Site) selection (see above).
MESObjectManager
This metric category displays information about MES Object actions (e.g. creation, saving, editing properties, etc).
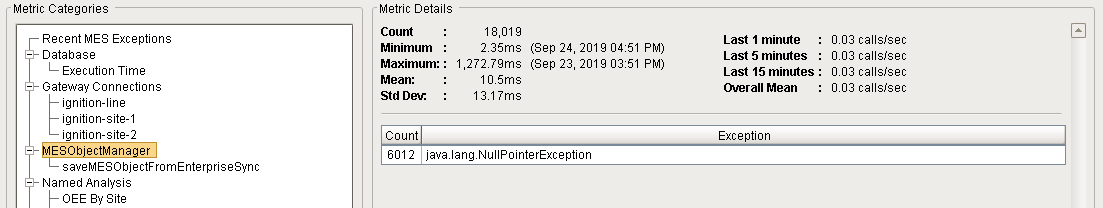
Data displayed in Metric Details section for the MESObjectManager selection:
| Name | Description |
|---|---|
| Count | Total number of MES Object actions on this server since metrics were started or reset. |
| Minimum | Fastest (minimum) connection time for an MES Object action on this server since metrics were started or reset. |
| Maximum | Slowest (maximum) connection time for an MES Object action on this server since metrics were started or reset. |
| Mean | Mean connection time for all MES Object actions on this server since metrics were started or reset. |
| Std Dev | The time for one sigma of standard deviation of variation in connection times for all MES Object actions on this server since metrics were started or reset. |
| Last 1 minute | The number of MES Object action calls on this server over the last 1 minute (or since since metrics were started or reset, if less than 1 minute). |
| Last 5 minutes | The number of MES Object action calls on this server over the last 5 minutes (or since since metrics were started or reset, if less than 5 minutes). |
| Last 15 minute | The number of MES Object action calls on this server over the last 15 minutes (or since since metrics were started or reset, if less than 15 minutes). |
| Overall Mean | The mean number of MES Object action calls on this server since metrics were started or reset. |
| (list of exceptions) |
Ignition-based exceptions on this server since metrics were started or reset.
If none, the message displayed is "No recent exceptions". |
Copy Exception Row
Right-clicking anywhere on an exception row brings up the Copy function. Click it to copy the description text to the clipboard (example: "java.lang.NullPointerException").
You can also copy by clicking to highlight a row and using Ctrl-C.
MESObjectManager - (MES Object Manager action)
This metric category displays information about a specific MES Object action (e.g. creation, saving, editing properties, etc). It has all the same information metric fields as the MESObjectManager selection above, but also includes a Last Value metric.
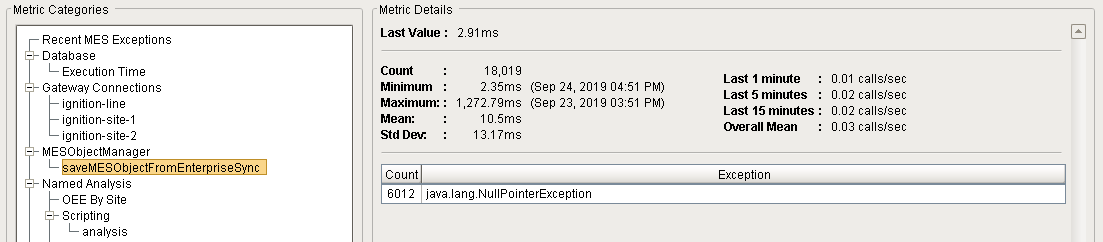
| Name | Description |
|---|---|
| Last Value | The access time for the last MES Object action on this server at the time that the line for the specific MES Object action was selected in the Metric Categories pane. |
| (other metrics) | Same as MESObjectManager section above. |
Named Analysis
This metric category displays information about various types of named analyses currently running or previously running on the server since metrics were started or reset. The analyses category also includes the sub category for scripted named analyses.
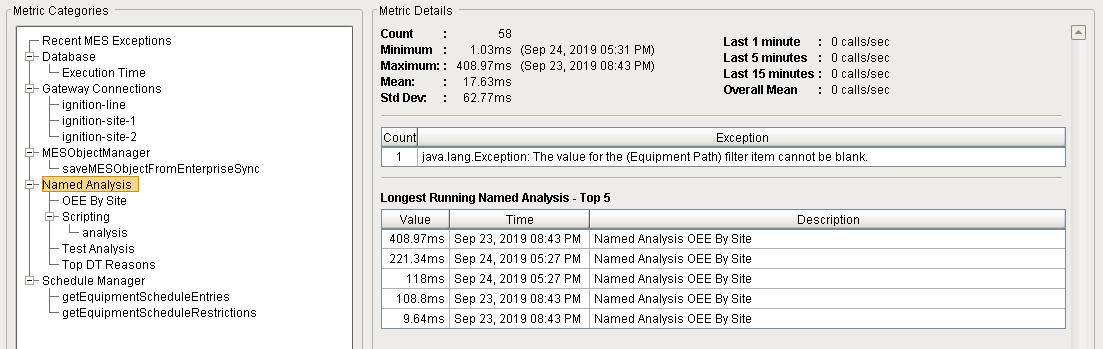
Data displayed in Metric Details section for the Named Analysis selection:
| Name | Description |
|---|---|
| Count | Total number of named analyses on this server since metrics were started or reset. |
| Minimum | Fastest (minimum) connection time for a named analysis on this server since metrics were started or reset. |
| Maximum | Slowest (maximum) connection time for a named analysis on this server since metrics were started or reset. |
| Mean | Mean connection time for all named analyses on this server since metrics were started or reset. |
| Std Dev | The time for one sigma of standard deviation of variation in connection times for all named analyses on this server since metrics were started or reset. |
| Last 1 minute | The number of named analysis calls on this server over the last 1 minute (or since since metrics were started or reset, if less than 1 minute). |
| Last 5 minutes | The number of named analysis calls on this server over the last 5 minutes (or since since metrics were started or reset, if less than 5 minutes). |
| Last 15 minute | The number of named analysis calls on this server over the last 15 minutes (or since since metrics were started or reset, if less than 15 minutes). |
| Overall Mean | The mean number of named analysis calls on this server since metrics were started or reset. |
| (list of exceptions) |
Ignition-based exceptions on this server since metrics were started or reset.
If none, the message displayed is "No recent exceptions". |
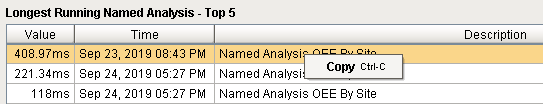
| Longest Running Named Analysis - Top 5 | Table of the top 5 longest-running named analysis calls on this server since metrics were started or reset. |
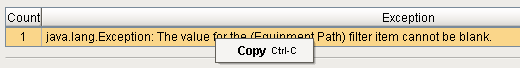
Copy Exception Row
Right-clicking anywhere on an exception row brings up the Copy function. Click it to copy the description text to the clipboard (example: "java.lang.NullPointerException").
You can also copy by clicking to highlight a row and using Ctrl-C.
Copy Gateway Connection Row
Right-clicking anywhere on a gateway connection row brings up the Copy function. Click it to copy the description text to the clipboard (example: "java.lang.Exception: The value for the (Equipment Path) filter item cannot be blank.").
You can also copy by clicking to highlight a row and using Ctrl-C.
Named Analysis - (named analysis)
This metric category displays information about a specific named analysis currently running or previously running on the server since metrics were started or reset. It has all the same information metric fields as the Named Analysis selection above, but also includes a Last Value metric.
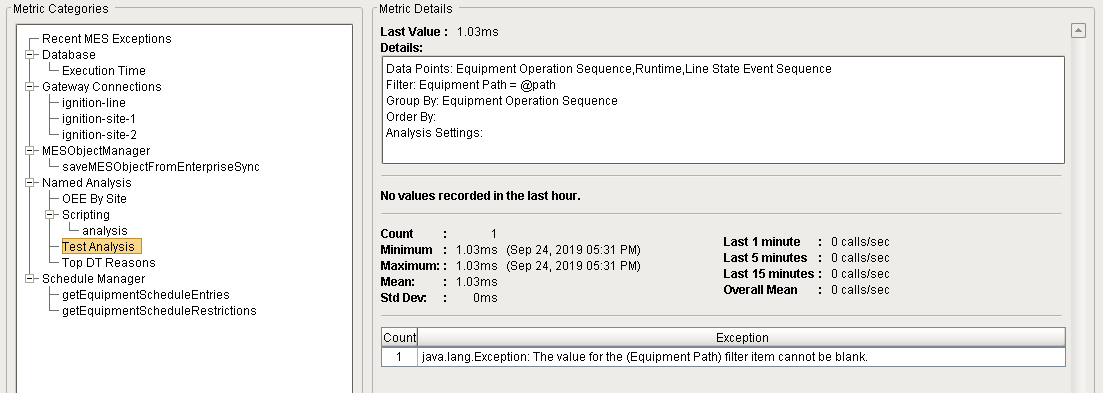
| Name | Description |
|---|---|
| Last Value | The access time for the last named analysis run on this server at the time that the line for the specific named analysis was selected in the Metric Categories pane. |
| (other metrics) | Same as Named Analysis section above. |
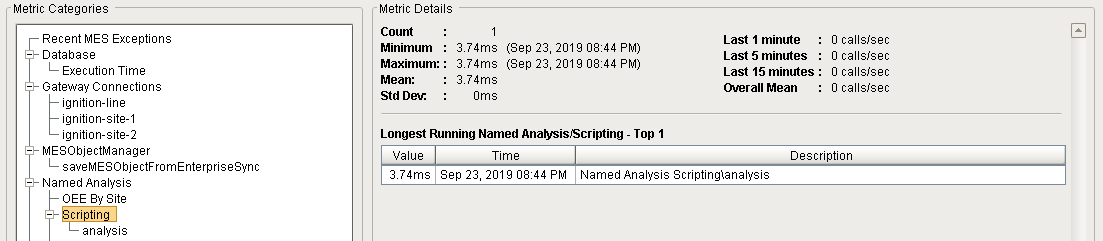
Named Analysis - Scripting
This metric category displays information about various types of scripted named analyses currently running or previously running on the server since metrics were started or reset. It has all the same information metric fields as the Named Analysis selection above.
Named Analysis - Scripting - (analysis)
This metric category displays information about a specific scripted named analysis currently running or previously running on the server since metrics were started or reset. It has all the same information metric fields as the Named Analysis selection above, but also includes a Last Value metric.
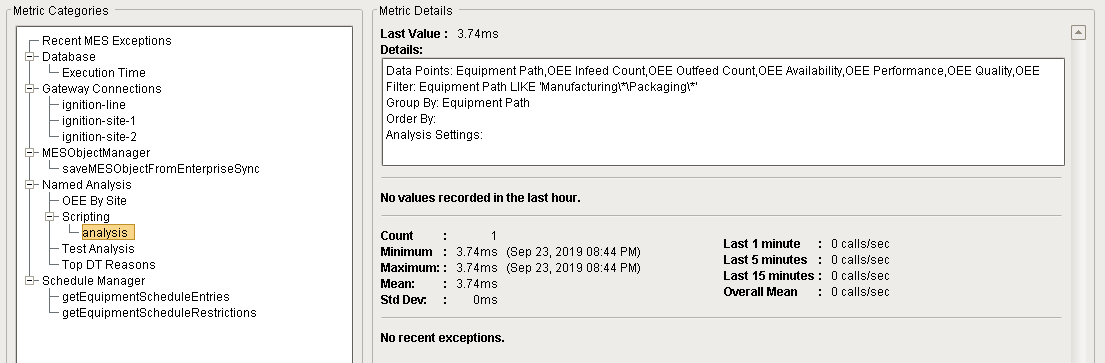
| Name | Description |
|---|---|
| Last Value | The access time for the last scripted named analysis run on this server at the time that the line for the specific scripted named analysis was selected in the Metric Categories pane. |
| (other metrics) | Same as Named Analysis section above. |
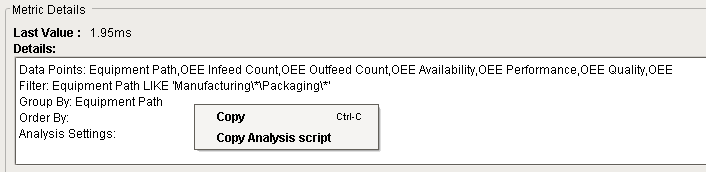
Copy Analysis Details
Right-clicking anywhere on a gateway connection row brings up the Copy and Copy Analysis Script functions. Click Copy to copy the displayed text to the clipboard:
Copy function results
Python |
[Code] def loadIcon(self, iconName): #Return a path to a different image to replace the default delete image: if iconName == 'remove': return 'Builtin/icons/24/delete2.png' |
Click Copy Analysis Script to copy the script required to execute the selected analysis to the clipboard:
Copy Analysis Script function results
Python |
end = system.date.now() begin = system.date.addHours(end, -8) analysis = system.mes.analysis.createMESAnalysisSettings('analysis') analysis.setDataPoints("Equipment Path,OEE Infeed Count,OEE Outfeed Count,OEE Availability,OEE Performance,OEE Quality,OEE") analysis.setFilterExpression("Equipment Path LIKE 'Manufacturing\*\Packaging\*'") analysis.setGroupBy("Equipment Path") # system.mes.analysis.executeAnalysis() returns an MES Analysis Results object # For documentation, see: https://help.sepasoft.com/docs/display/MHD/MES+Analysis+Results results = system.mes.analysis.executeAnalysis(begin, end, analysis) if results.hasMessage(): count = results.getMessageCount() message_list = [str(results.getMessage(index)) for index in range(count)] # getDataset() returns an Ignition Dataset # For documentation, see: https://docs.inductiveautomation.com/display/DOC79/Datasets dataset = results.getDataset() sep = ",\t" print sep.join(dataset.getColumnNames()) for row in range(dataset.getRowCount()): print sep.join(map(str, dataset.getRow(row))) |
Schedule Manager
This metric category displays information about MES Schedule Manager component actions (e.g. creation, saving, editing properties, etc).
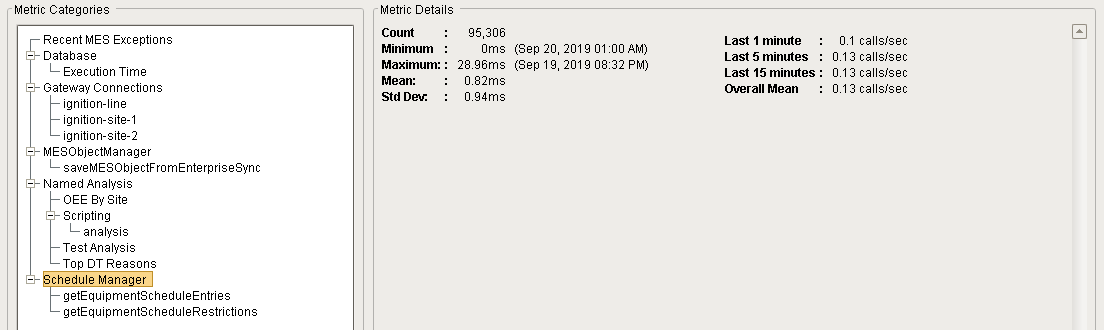
Data displayed in Metric Details section for the Schedule Manager selection:
| Name | Description |
|---|---|
| Count | Total number of MES Schedule Manager component actions on this server since metrics were started or reset. |
| Minimum | Fastest (minimum) connection time for an MES Schedule Manager component action on this server since metrics were started or reset. |
| Maximum | Slowest (maximum) connection time for an MES Schedule Manager component action on this server since metrics were started or reset. |
| Mean | Mean connection time for all MES Schedule Manager component actions on this server since metrics were started or reset. |
| Std Dev | The time for one sigma of standard deviation of variation in connection times for all MES Schedule Manager component actions on this server since metrics were started or reset. |
| Last 1 minute | The number of an MES Schedule Manager component action calls on this server over the last 1 minute (or since since metrics were started or reset, if less than 1 minute). |
| Last 5 minutes | The number of MES Schedule Manager component action calls on this server over the last 5 minutes (or since since metrics were started or reset, if less than 5 minutes). |
| Last 15 minute | The number of MES Schedule Manager component action calls on this server over the last 15 minutes (or since since metrics were started or reset, if less than 15 minutes). |
| Overall Mean | The mean number of MES Schedule Manager component action calls on this server since metrics were started or reset. |
Schedule Manager - (schedule)
This metric category displays information about a specific MES Schedule Manager component action (e.g. creation, saving, editing properties, etc). It has all the same information metric fields as the Schedule Manager selection above, but also includes a Last Value metric.
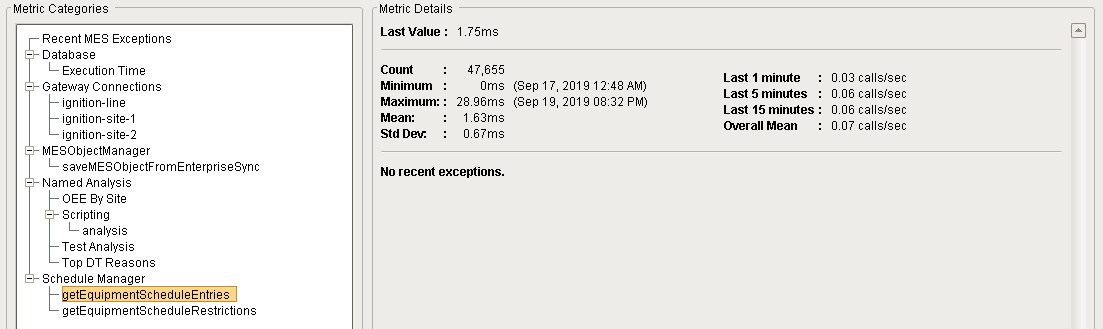
| Name | Description |
|---|---|
| Last Value | The access time for the last MES Schedule Manager component action on this server at the time that the line for the specific MES Schedule Manager component action selected in the Metric Categories pane. |
| (other metrics) | Same as Schedule Manager section above. |
Custom Timers
For performance monitoring and debugging, custom timers are available in the MES Monitoring component, which allow users to start and stop a timer via scripting, to capture server performance metrics for the specified duration.
Custom Timer
This metric category displays information about the custom timers that have been created.
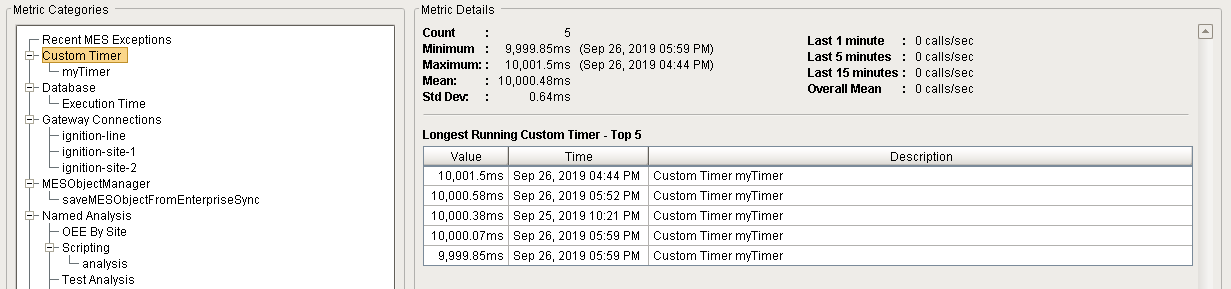
Data displayed in Metric Details section for the Custom Timer selection:
| Name | Description |
|---|---|
| Count | Total number of custom timers running or have run on this server since metrics were started or reset. |
| Minimum | Fastest (minimum) connection time for a custom timer on this server since metrics were started or reset. |
| Maximum | Slowest (maximum) connection time for a custom timer on this server since metrics were started or reset. |
| Mean | Mean connection time for all custom timers on this server since metrics were started or reset. |
| Std Dev | The time for one sigma of standard deviation of variation in connection times for all custom timers on this server since metrics were started or reset. |
| Last 1 minute | The number of custom timer calls on this server over the last 1 minute (or since since metrics were started or reset, if less than 1 minute). |
| Last 5 minutes | The number of custom timer calls on this server over the last 5 minutes (or since since metrics were started or reset, if less than 5 minutes). |
| Last 15 minute | The number of custom timer calls on this server over the last 15 minutes (or since since metrics were started or reset, if less than 15 minutes). |
| Overall Mean | The mean number of custom timer calls on this server since metrics were started or reset. |
| Longest Running Custom Timer - Top 5 | Table of the top 5 longest-running custom timer calls on this server since metrics were started or reset. |
Custom Timer - (timer)
This metric category displays information about a specific custom timer. It has all the same information metric fields as the Custom Timer selection above (except Longest Running Custom Timer - Top 5), but also includes a Last Value metric.
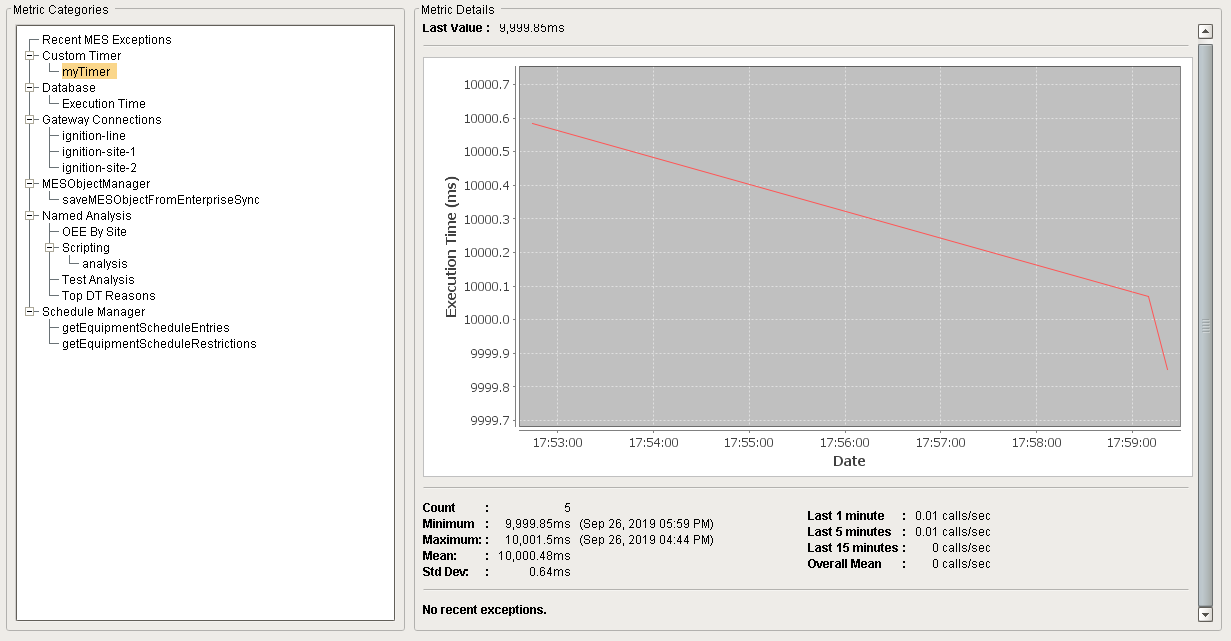
| Name | Description |
|---|---|
| Last Value | The access time for the last custom timer action on this server at the time that the line for the specific custom timer selected in the Metric Categories pane. |
| (graph) | Same functionality as described in the Execution Times Graph section of Gateway Connections - (Site) above. |
| (other metrics) | Same as Custom Timer section above. |
| (list of exceptions) |
Ignition-based exceptions on this server since metrics were started or reset.
If none, the message displayed is "No recent exceptions". |
Refer to system.mes.monitor.start for information on creating and starting a custom timer.
Custom Values
For monitoring-related activities and debugging, custom value entries are available in the MES Monitoring component, which allow users to save string or numeric values and calculate metrics based on their creation times.
Custom Value
This metric category displays information about the custom values that have been created.
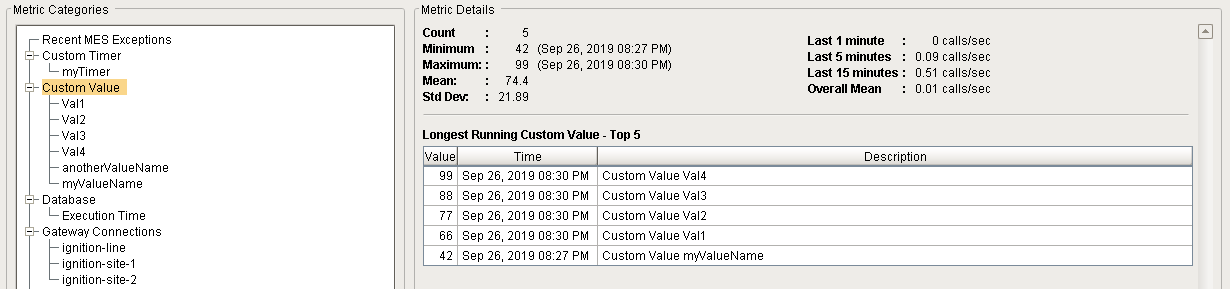
Data displayed in Metric Details section for the Custom Value selection:
| Name | Description |
|---|---|
| Count | Total number of custom values on this server since metrics were started or reset. |
| Minimum | Fastest (minimum) connection time for a custom value on this server since metrics were started or reset. |
| Maximum | Slowest (maximum) connection time for a custom value on this server since metrics were started or reset. |
| Mean | Mean connection time for all custom timers on this server since metrics were started or reset. |
| Std Dev | The time for one sigma of standard deviation of variation in connection times for all custom values on this server since metrics were started or reset. |
| Last 1 minute | The number of custom value calls on this server over the last 1 minute (or since since metrics were started or reset, if less than 1 minute). |
| Last 5 minutes | The number of custom value calls on this server over the last 5 minutes (or since since metrics were started or reset, if less than 5 minutes). |
| Last 15 minute | The number of custom value calls on this server over the last 15 minutes (or since since metrics were started or reset, if less than 15 minutes). |
| Overall Mean | The mean number of custom value calls on this server since metrics were started or reset. |
| Longest Running Custom Value - Top 5 | Table of the top 5 longest-running custom value calls on this server since metrics were started or reset. |
Custom Value - (value)
This metric category displays information about a specific custom value. It has all the same information metric fields as the Custom Value selection above (except Longest Running Custom Value - Top 5), but also includes a Last Value metric.
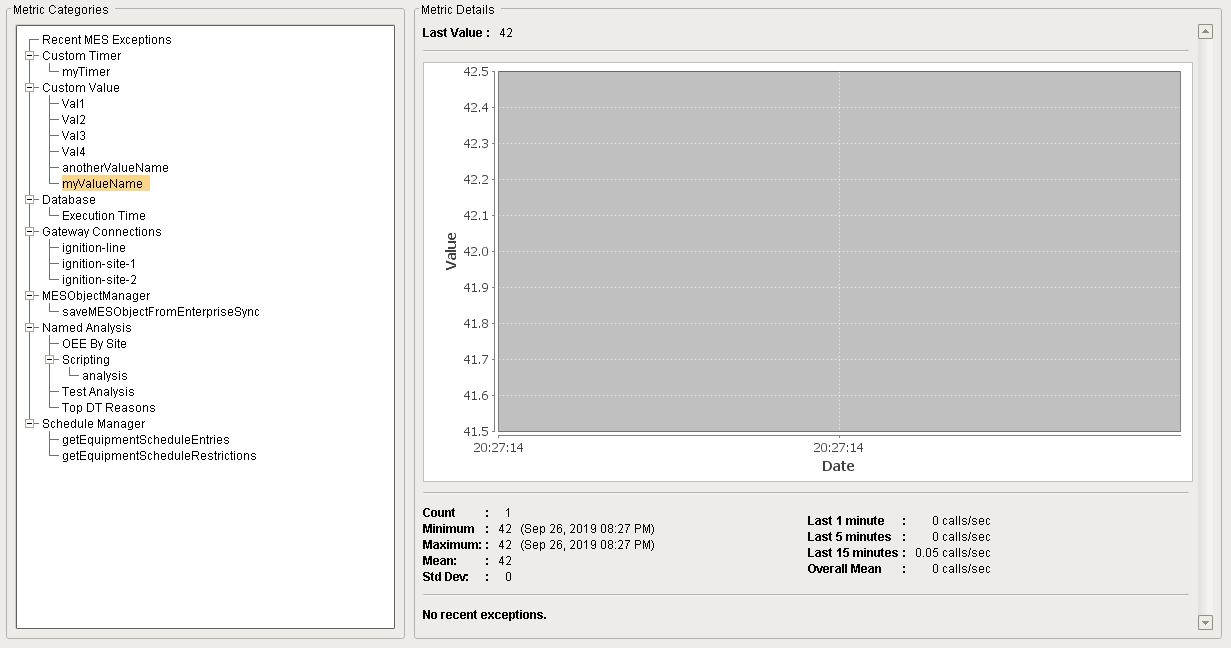
| Name | Description |
|---|---|
| Last Value | The access time for the last custom value action on this server at the time that the line for the specific custom value selected in the Metric Categories pane. |
| (graph) | Same functionality as described in the Execution Times Graph section of Gateway Connections - (Site) above. |
| (other metrics) | Same as Custom Value section above. |
| (list of exceptions) |
Ignition-based exceptions on this server since metrics were started or reset.
If none, the message displayed is "No recent exceptions". |
Refer to system.mes.monitor.value for information on creating a custom value.
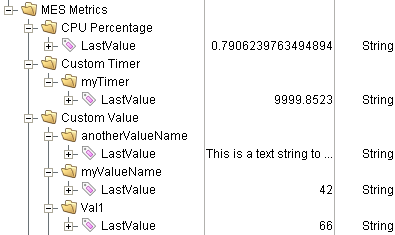
Tags
Tags are created for for each metrics category in the Metrics Categories pane, to allow live monitoring and control via Ignition components, MES components, and scripts.
All metrics tags are created and updated as type String by the MES Monitor component, regardless of whether they are numeric in nature (example: the .increment (n) and .decrement(n) Counter object methods treat them locally as integers, but their associated tags remain as type String).
Component Properties
Properties are provided that can be set to affect the operation and look of the component. They can be set through the Property Editor in the Designer or through scripting.
Example
Python |
event.source.parent.getComponent('MES Monitor').componentEnabled = False |
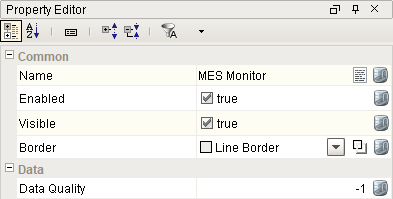
Common
| Name | Scripting | Property Type | Description |
|---|---|---|---|
| Name | name | String | Name of the component. |
| Enabled | componentEnabled | Boolean | If true, component is enabled. |
| Visible | visible | Boolean | If true, component is visible. |
| Border | border | Border | Type of border around the component. |
Data
| Name | Scripting | Property Type | Description |
|---|---|---|---|
| Show Enterprise Network | showEnterpiseNetwork | Boolean |
When set to False (default), the server's local node and its descendants are shown. When set to True, the entire Enterprise is shown in the graph. |
| Quality | dataQuality | Integer | The data code for any tag bindings on this component. |
Appearance
There are no appearance properties for this component.
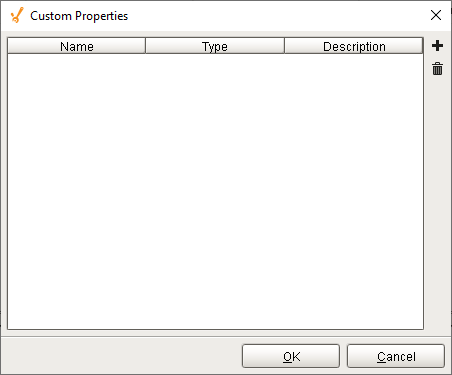
Custom Properties
The custom properties can be used to add user defined properties.
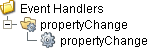
Event Handlers
Event handlers provide the ability to add custom script when a user interacts with a component such as by clicking a mouse, selecting a menu item or when a component property changes.
propertyChange
propertyChange
Fires whenever a bindable property of the source component changes. This works for standard and custom properties of the component.
|
Property |
Description |
|---|---|
|
.source |
The component that fired this event. |
|
.newValue |
The new value that this property changed to. |
|
.oldValue |
The value that this property was before it changed. Note that not all components include an accurate oldValue in their events. |
|
.propertyName |
The name of the property that changed. NOTE: Remember to always filter out these events for the property that you are looking for! Components often have many properties that change. |
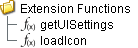
Extension Functions
Extension functions allow the operation of a component to be altered and also provide great flexibility in customizing the look of this component. Extension functions cannot be called, they are event driven. See Component Extension Functions in the Ignition Help Manual for more information.
getUISettings
-
Description
Called to customize the settings (colors, fonts, constraints) for the MES Monitor component.
-
Parameters
self - A reference to the component that is invoking this function.
uiSettings - The settings object used to customize the appearance of the MES Monitor's UI.
-
Return
uiSettings - The settings object used to customize the appearance of the MES Monitor's UI.
-
Scope
Client
Example: Get UI Settings
Code |
[Code] def loadIcon(self, iconName): #Return a path to a different image to replace the default delete image: if iconName == 'remove': return 'Builtin/icons/24/delete2.png' |
loadIcon
-
Description
Allows users to change an icon. based on the icon name parameter, returns the image path to the icon to use in place of the default icon.
-
Parameters
self - A reference to the component that is invoking this function.
iconName - The name of the icon.
-
Return
Returns a dictionary of name-value pairs with the desired attributes.
-
Scope
Client
Example: Load Icon
Code |
[Code] def loadIcon(self, iconName): #Return a path to a different image to replace the default delete image: if iconName == 'remove': return 'Builtin/icons/24/delete2.png' |
Custom Methods
Custom methods allow you to add your own component functions to a component that can be called through scripting. This is a useful and clean method of re-using script that is specific to the component (say you want to update a visual aspect of the component in the same way whether a user clicks on the component or a window property value changes. See Component Custom Methods in the Ignition Help Manual for more information.

Component Functions
This component does not have component functions associated with it.
Scripting Functions
Several scripting functions available to support MES Monitor timer and counter activities:Component Objects
This component does not have objects associated with it.
Sepasoft MES Module Suite