Sepasoft MES Module Suite
Control Limit Events
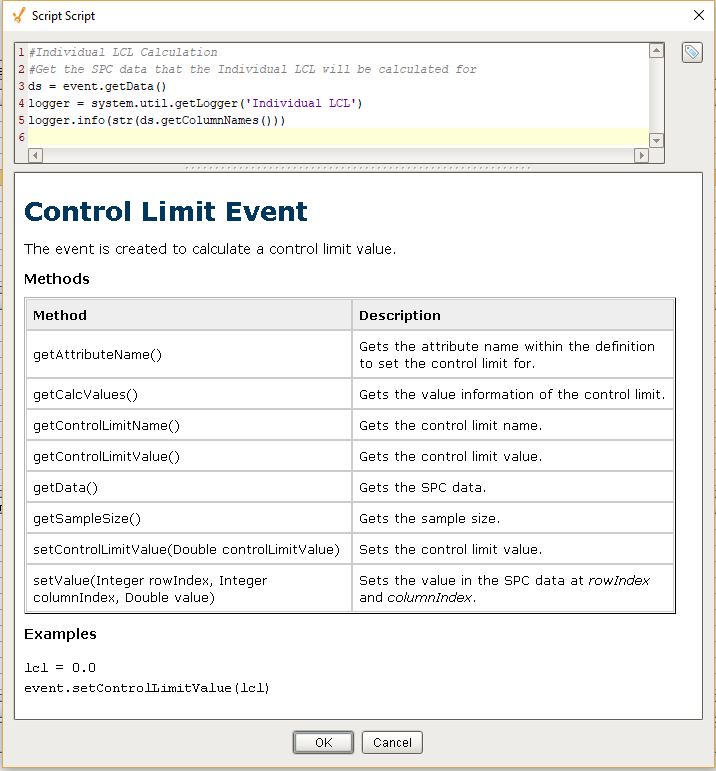
The event is executed to calculate a control limit value. Whenever control limits are calculated, the script in the associated control limit is executed. All control limit events have getData() function to return the SPC data.
Example
The following code snippet logs the column names of the dataset returned by Individual LCL control limit.
Code Snippet
Python |
ds = event.getData() logger = system.util.getLogger('Individual LCL') #logs column names to the gateway console logger.info(str(ds.getColumnNames())) |
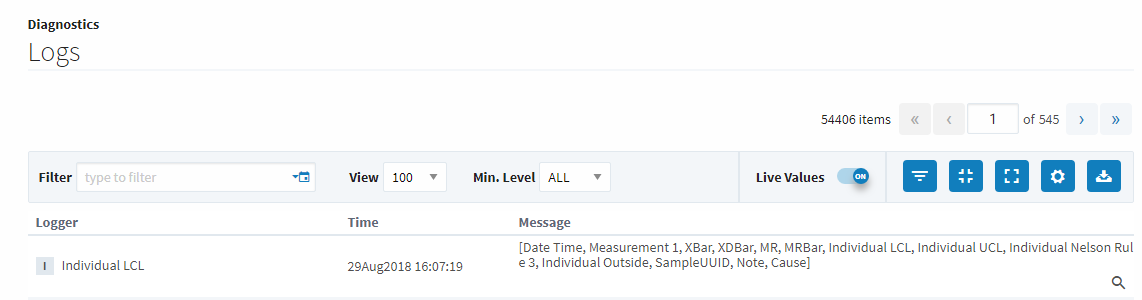
Output
Python |
[Date Time, Measurement 1, XBar, XDBar, MR, MRBar, Individual LCL, Individual UCL, SampleUUID, Note, Cause] |
System is set to use up to 6 decimal point places for Control Limit Values: When calculating control limits the system uses the Attribute Property format property to determine how to display the limit value (i.e., how many digits after the decimal to use if the control limit calculated value is of a decimal value)
Column Names Corresponding to Control Limits
Column names of the dataset returned by event.getData() corresponding to each chart is given below.
| Control Limits | Column Names |
|---|---|
| Box and Whisker LCL | Location, ProductCode, AttrValue, SampleUUID, Note, Cause |
| Box and Whisker UCL | Location, ProductCode, AttrValue, SampleUUID, Note, Cause |
| Cp LSL | Date Time, Measurement, Low Boundary, High Boundary, Frequency, Cp, Cpk, Cr, Cpm, Cpl, Cpu, Mean, LCL, UCL, StdDev, SampleUUID, Note, Cause |
| Cp Target | Date Time, Measurement, Low Boundary, High Boundary, Frequency, Cp, Cpk, Cr, Cpm, Cpl, Cpu, Mean, LCL, UCL, StdDev, SampleUUID, Note, Cause |
| Cp USL | Date Time, Measurement, Low Boundary, High Boundary, Frequency, Cp, Cpk, Cr, Cpm, Cpl, Cpu, Mean, LCL, UCL, StdDev, SampleUUID, Note, Cause |
| CpPp LSL | Date Time, Measurement, Low Boundary, High Boundary, Frequency, Cp, Cpk, Cr, Cpm, Cpl, Cpu, CpLCL, CpUCL, CpStdDev, Pp, Ppk, Pr, Ppm, Ppl, Ppu, PpLCL, PpUCL, PpStdDev, Mean, SampleUUID, Note, Cause |
| CpPp Target | Date Time, Measurement, Low Boundary, High Boundary, Frequency, Cp, Cpk, Cr, Cpm, Cpl, Cpu, CpLCL, CpUCL, CpStdDev, Pp, Ppk, Pr, Ppm, Ppl, Ppu, PpLCL, PpUCL, PpStdDev, Mean, SampleUUID, Note, Cause |
| CpPp USL | Date Time, Measurement, Low Boundary, High Boundary, Frequency, Cp, Cpk, Cr, Cpm, Cpl, Cpu, CpLCL, CpUCL, CpStdDev, Pp, Ppk, Pr, Ppm, Ppl, Ppu, PpLCL, PpUCL, PpStdDev, Mean, SampleUUID, Note, Cause |
| Histogram LCL | Low Boundary, High Boundary, Frequency, SampleUUID, Note, Cause |
| Histogram UCL | Low Boundary, High Boundary, Frequency, SampleUUID, Note, Cause |
| Individual LCL | Date Time, Measurement, XBar, XDBar, MR, MRBar, SampleUUID, Note, Cause |
| Individual UCL | Date Time, Measurement, XBar, XDBar, MR, MRBar, SampleUUID, Note, Cause |
| MR LCL | Date Time, Measurement, XBar, XDBar, MR, MRBar, SampleUUID, Note, Cause |
| MR UCL | Date Time, Measurement, XBar, XDBar, MR, MRBar, SampleUUID, Note, Cause |
| Median LCL | Date Time, Measurement, Low, High, Median, MedianBar, Range, RBar, SampleUUID, Note, Cause |
| Median UCL | Date Time, Measurement, Low, High, Median, MedianBar, Range, RBar, SampleUUID, Note, Cause |
| Pp LSL | Low Boundary, High Boundary, Frequency, Pp, Ppk, Pr, Ppm, Ppl, Ppu, Mean, LCL, UCL, StdDev, SampleUUID, Note, Cause |
| Pp Target | Low Boundary, High Boundary, Frequency, Pp, Ppk, Pr, Ppm, Ppl, Ppu, Mean, LCL, UCL, StdDev, SampleUUID, Note, Cause |
| Pp USL | Low Boundary, High Boundary, Frequency, Pp, Ppk, Pr, Ppm, Ppl, Ppu, Mean, LCL, UCL, StdDev, SampleUUID, Note, Cause |
| Range LCL | Median or XBar chart can be used with this control limit. The column names will be according to the chart you used. If you select XBar then the column names will be same as XBar and if you choose Median the column names will be same as Median. |
| Range UCL | Median or XBar chart can be used with this control limit. The column names will be according to the chart you used. If you select XBar then the column names will be same as XBar and if you choose Median the column names will be same as Median. |
| StdDev LCL | Individual or XBar chart can be used with this control limit. The column names will be according to the chart you used. If you select XBar then the column names will be same as XBar and if you choose Individual the column names will be same as Individual. |
| StdDev UCL | Individual or XBar chart can be used with this control limit. The column names will be according to the chart you used. If you select XBar then the column names will be same as XBar and if you choose Individual the column names will be same as Individual. |
| XBar LCL | Date Time, Measurement, Sum, XBar, XDBar, Range, RBar, SampleUUID, Note, Cause |
| XBar LSL | Date Time, Measurement, Sum, XBar, XDBar, Range, RBar, SampleUUID, Note, Cause |
| XBar UCL | Date Time, Measurement, Sum, XBar, XDBar, Range, RBar, SampleUUID, Note, Cause |
| XBar USL | Date Time, Measurement, Sum, XBar, XDBar, Range, RBar, SampleUUID, Note, Cause |
| c LCL | Total Nonconformities, InspectedCount, c, cBar, SampleUUID, Note, Cause |
| c UCL | Total Nonconformities, InspectedCount, c, cBar, SampleUUID, Note, Cause |
| np LCL | Total Nonconforming, InspectedCount, np, npBar, SampleUUID, Note, Cause |
| np UCL | Total Nonconforming, InspectedCount, np, npBar, SampleUUID, Note, Cause |
| p LCL | Date Time, Measurement, Total Nonconforming, InspectedCount, p, pBar, SampleUUID, Note, Cause |
| p UCL | Date Time, Measurement, Total Nonconforming, InspectedCount, p, pBar, SampleUUID, Note, Cause |
| u LCL | Date Time, Measurement, Total Nonconformities, InspectedCount, u, uBar, SampleUUID, Note, Cause |
| u UCL | Date Time, Measurement, Total Nonconformities, InspectedCount, u, uBar, SampleUUID, Note, Cause |
Object Functions
getAttributeName()
Description
Returns the attribute name within the definition to set the control limit for.
Syntax
getAttributeName()
- Parameters
None
- Returns
String attributeName - The attribute name of the control limit.
- Scope
All
getCalcValues()
Description
Returns the value information of the control limit.
Syntax
getCalcValues()
- Parameters
None
- Returns
SPCCalcValueCollection calcValues - The calculated value of the control limit.
- Scope
All
Code Examples
Code Snippet
Code |
|
Output
Code |
XBar |
getControlLimitName()
Description
Returns the name of the control limit.
Syntax
getControlLimitName()
- Parameters
None
- Returns
String controlLimitName - The name of the control limit.
- Scope
All
getControlLimitValue()
Description
Returns the value of the control limit.
Syntax
getControlLimitValue()
- Parameters
None
- Returns
Double controlLimitValue - The value of the control limit.
- Scope
All
getData()
Description
Returns the SPC data.
Syntax
getData()
- Parameters
None
- Returns
AnalysisDataset data - The SPC data.
- Scope
All
getSampleSize()
Description
Returns the sample size.
Syntax
getSampleSize()
- Parameters
None
- Returns
Integer sampleSize - The sample size associated with this control limit.
- Scope
All
setControlLimitValue(controlLimitValue)
Description
Sets the control limit value.
Syntax
setControlLimitValue(controlLimitValue)
- Parameters
Double controlLimitValue - The value of the control limit.
- Returns
Nothing
- Scope
All
setValue(rowIndex, columnIndex, value)
Description
Sets the value in the SPC data at the specified rowIndex and columnIndex.
Syntax
setValue(rowIndex, columnIndex, value)
- Parameters
None
- Returns
AnalysisDataset data - The SPC data.
- Scope
All
Sepasoft MES Module Suite