Sepasoft MES Module Suite
Live Analysis
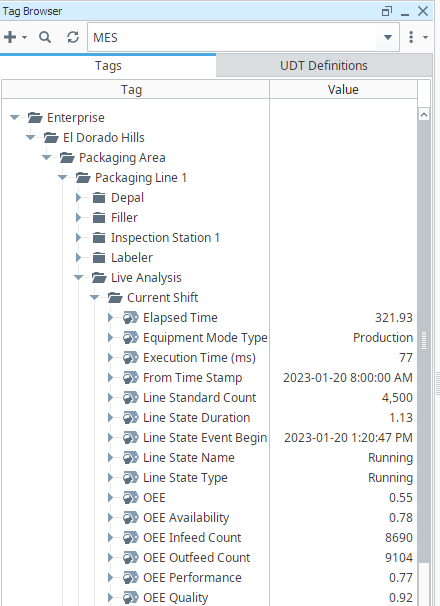
Live Analysis provides a flexible way of customizing your application to provide a set of real-time tag values that can be accessed from the Ignition Designer and used in your application to provide real-time production monitoring. Live Analysis is configured in the MES Equipment Manager for the Line, Cell Group and Cell production items. When a Live Analysis is created, a corresponding set of tags is created in the MES Tag Provider that provide the real-time status of those datapoints based upon the Period defined for the Live Analysis. You can create multiple Live Analysis and use those tags to drive HMI displays.
DateTime Tags Display Differently in Ignition 7 versus Ignition 8

|
DateTime Tags in Ignition 7 and Ignition 8 As an example, consider two Ignition Gateways, one is Ignition 7, the other Ignition 8. Both gateways are set to UTC, while the Designer/Client machine is set to PST. There is a 7 hour difference between UTC and PST. In Ignition 7, Date tags translate to PST. In Ignition 8, Date tags show as UTC |
Create a New Live Analysis Profile
To complete these steps, you must have at least one Line in your Production Equipment Model.
- In Equipment Manager, select a line, cell group or cell and from General, click Live Analysis.
- Add Live Analysis and then Edit Live Analysis.
- Refer to the Live Analysis Settings table to configure the live analysis.
|
|
You cannot select all Data Points in one Live Analysis. The maximum length string for Data Points is 1024 characters |
Live Analysis Settings
| Setting | Description | ||||
|---|---|---|---|---|---|
Analysis Name | The name for the live analysis | ||||
Enabled | The live analysis can be enabled or disabled with this setting | ||||
Period | The duration of analysis can be set by:
| ||||
Custom Period Tag | A tag can be assigned to define the start datetime for a custom period. The end time will be the current time. It takes value in the date time data type. Example for a valid value for the custom period tag is:
| ||||
Update Rate | The rate in seconds by which the live analysis is updated. The minimum update rate is 60 seconds. Default value is 60 seconds. | ||||
| Data Points | Data points allows you to pick and choose the values you wish to access through tags. See the table below for the listing of available data points | ||||
| Optional Filter | The optional filter has the same rules as the analysis selector filter but it must not contain any of the following since live analysis is already filtered to an equipment:
Example: filter_expression = "Shift='Morning' AND (Line State Type='Planned Downtime' OR Line State Type='Unplanned Downtime' OR Line State Type='Unknown')" | ||||
| Setting Values | Various filters and qualifiers are available to refine live analysis results. See Analysis Data Points and Settings > Setting Values. |

A new folder with your live analysis name will be added to MES tag browser.
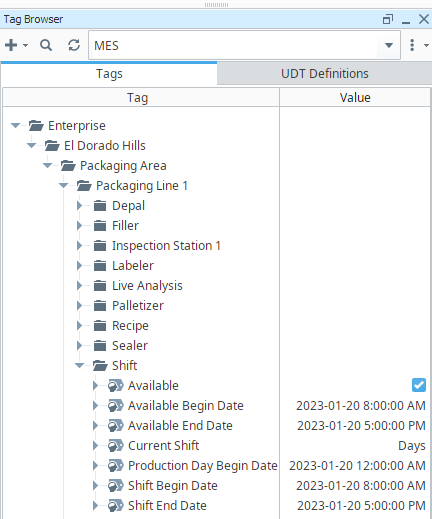
Shift Data Points in Live Analysis
When creating a Live Analysis, the following shift data points will be automatically created.
| Data Point | Data Type | Description | ||
|---|---|---|---|---|
| Available | Boolean | True if the line is currently within an available period. | ||
| Available Begin Date | DateTime | If in an available time, this is the time that that availability began. If in an unavailable time, it reflects the begin date of the most recent availability period. | ||
| Available End Date | DateTime | If in an available time, this is the time that that availability ended. If in an unavailable time, it reflects the ending date of the most recent availability period. | ||
| Current Shift | String | The currently running shift as defined in the Ignition Schedule Management component or passed from the Shift Tag Collector path. | ||
| Production Day Begin Date | DateTime | Start time of the production day's first shift.
| ||
| Shift Begin Date | DateTime | Start time of the Current Shift (the time the Current Shift tag first changed to a given value). | ||
| Shift End Date | DateTime | Ending time of the Current Shift. |
For details, see Analysis Data Points and Settings.
Sepasoft MES Module Suite