Sepasoft MES Module Suite
Signals of Rule Violations
Signals provide a method for notifying us of an out-of-control process or rule violation that may indicate an abnormal change in the process. The SPC module provides built-in signals that satisfy the standard Nelson and Western Electric Rules such as six points in a row that are increasing or decreasing, eight points in a row that are farther than one standard deviation away from the center line, or fourteen points in a row that are alternating up and down. The SPC module also lets you build your own custom signals or you can modify the ones provided for you.
When used properly, these signals can identify important changes that can help to improve or maintain the process.
Default Signals

|
Wikipedia has a nice visual description on the Nelson Rules and WE Zone Rules. |
The following default control limits are provided when the SPC module is first installed:
| Signal | Kind | Description |
|---|---|---|
| Individual Nelson Rule 1 | Individual | One point is more than 3 standard deviations from the mean. |
| Individual Nelson Rule 2 | Individual | Nine (or more) points in a row are on the same side of the mean. |
| Individual Nelson Rule 3 | Individual | Six (or more) points in a row are continually increasing (or decreasing). |
| Individual Nelson Rule 4 | Individual | Fourteen (or more) points in a row alternate in direction, increasing then decreasing. |
| Individual Nelson Rule 5 | Individual | Two (or three) out of three points in a row are more than 2 standard deviations from the mean in the same direction. |
| Individual Nelson Rule 6 | Individual | Four (or five) out of five points in a row are more than 1 standard deviation from the mean in the same direction. |
| Individual Nelson Rule 7 | Individual | Fifteen points in a row are all within 1 standard deviation of the mean on either side of the mean. |
| Individual Nelson Rule 8 | Individual | Eight points in a row exist, but none within 1 standard deviation of the mean, and the points are in both directions from the mean. |
| Individual Outside | Individual | A single sample point outside the defined control limits. |
| Median Nelson Rule 1 | Median | One point is more than 3 standard deviations from the mean. |
| Out Of Limits | XBar | XBar above 'XBar UCL' or below 'XBar LCL' control limits (those control limits must be set for this signal to work). |
| Outside Limits | Range | Range above 'Range UCL' or below 'Range LCL' control limits (those control limits must be set for this signal to work). |
| WE Zone Rule 1 | XBar | Any single data point falls outside the 3σ limit from the centerline (i.e., any point that falls outside Zone A, beyond either the upper or lower control limit). |
| WE Zone Rule 2 | XBar | Two out of three consecutive points fall beyond the 2σ limit (in zone A or beyond), on the same side of the centerline. |
| WE Zone Rule 3 | XBar | Four out of five consecutive points fall beyond the 1σ limit (in zone B or beyond), on the same side of the centerline. |
| WE Zone Rule 4 | XBar | Eight consecutive points fall on the same side of the centerline (in zone C or beyond). |
| XBar 8 Above Control Line | XBar | Eight Consecutive points above control line signal calculation. |
| XBar 8 Below Control Line | XBar | Eight Consecutive points below control line signal calculation. |
| XBar Nelson Rule 1 | XBar | One point is more than 3 standard deviations from the mean. |
| XBar Nelson Rule 2 | XBar | Nine (or more) points in a row are on the same side of the mean. |
| XBar Nelson Rule 3 | XBar | Six (or more) points in a row are continually increasing (or decreasing). |
| XBar Nelson Rule 4 | XBar | Fourteen (or more) points in a row alternate in direction, increasing then decreasing. |
| XBar Nelson Rule 5 | XBar | Two (or three) out of three points in a row are more than 2 standard deviations from the mean in the same direction. |
| XBar Nelson Rule 6 | XBar | Four (or five) out of five points in a row are more than 1 standard deviation from the mean in the same direction. |
| XBar Nelson Rule 7 | XBar | Fifteen points in a row are all within 1 standard deviation of the mean on either side of the mean. |
| XBar Nelson Rule 8 | XBar | Eight points in a row exist, but none within 1 standard deviation of the mean, and the points are in both directions from the mean. |
| c Nelson Rule | c | One point is more than 3 standard deviations from the mean (Nelson Rule 1). |
| np Nelson Rule 1 | np | One point is more than 3 standard deviations from the mean (Nelson Rule 1). |
| p Nelson Rule | p | One point is more than 3 standard deviations from the mean (Nelson Rule 1). |
| u Nelson Rule | u | One point is more than 3 standard deviations from the mean (Nelson Rule 1). |
Signals can be configured so that they are evaluated every time new sample data is recorded. This allows for quick and automatic detection of out of control conditions. Once an out of control condition is detected, a a variety of actions can be performed, such as alerting of personnel via alarms, text messaging, even shutdown of a process until the process has been verified.
For automatic signal evaluation to be enabled, the Look Back Period must be set to something other than No Auto Evaluation, a Look Back Duration must be set, and the signal must be selected for the desired sample definitions.
Adding and Editing Signals
Out of Control Signals can be added, edited or deleted on the Enterprise page in the designer under the Quality tab as shown . To add an out of control signal, right-click on the Out of Control Signals pane and select New from the drop-down menu. Select Edit to edit an existing Out of Control signal.
Out of Control Signals (Rules) are available in the MES Equipment Manager at the Enterprise level of the Production Model.
To add a new signal/rule, in the MES Equipment Manager, click on Out of Control Signals on the Enterprise level of the Production Model and click New. A window will appear with several fields to be completed.
To edit an existing signal/rule, click on Out of Control Signals on the Enterprise level of the Production Model and click Edit next to the signal/rule to modify. Click Save when done making edits.
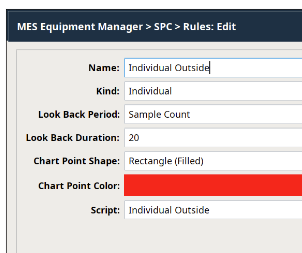
| Property | |||||||||||||||||||||||||
|---|---|---|---|---|---|---|---|---|---|---|---|---|---|---|---|---|---|---|---|---|---|---|---|---|---|
Signal Name | This is the required unique name of the signal as it will appear in selection lists and control charts. It is better to keep this short in length so that it will fit better on the control charts. | ||||||||||||||||||||||||
Kind | Each type of control chart has signal kinds that it works with. If a signal will be used with a Individual control chart, then the Individual signal kind must be used.
| ||||||||||||||||||||||||
| Calculation Script | Because signal calculations can vary, the SPC module exposes how the calculation is performed as a python script. This allows the user to override the default calculation of a signal or create new signals that the SPC module does not provide by default. Additionally, they can be removed, cleaning up selection lists of signals that may never be used. Signals are evaluated when viewing them on control charts or when new sample data is recorded. When either of these trigger the signals to be calculated, the script in the associated signal is executed. An event object is passed into the script that contains the information and data to calculate the signal state values. Refer to the Signal Evaluated Event object for more information.
| ||||||||||||||||||||||||
Look Back Period | This property defines the time units of the Look Back Duration property.
| ||||||||||||||||||||||||
| Look Back Duration | When automatic signal evaluation is used, this property, along with the Look Back Period property, defines the time range or count of samples to pass to the calculation script. The calculation script can then cycle through the range of samples to find out of control conditions. | ||||||||||||||||||||||||
| Chart Point Color | The color to display for sample values that are considered out-of-control on the control charts. | ||||||||||||||||||||||||
Chart Point Shape | This is the shape to display for sample values that are considered out-of-control on the control charts. |
Delete Signals
To delete an out of control signal, select the item to be deleted. After selecting, right-click the item and select Delete from the drop-down menu. A window as shown below will appear confirming that you permanently want to delete the out of control signal.
Importing and Exporting Signals
Export
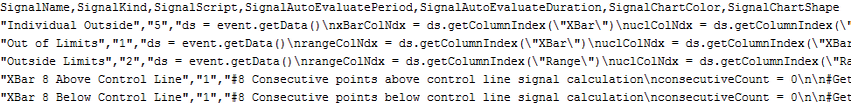
To export signal entries, right-click anywhere on the table containing signal entries and select the Export menu item. A dialog box will appear to allow for the selection of an existing file or the entry of a name for the new file to which the out of control signal entries are saved. If a file extension is not entered, then the default .csv will be used. The first line of the file must at least contain the property names separated by commas. If additional names exist, they will be ignored. The property names can be in any order. Below is a sample csv file showing multiple signal entries. The lines in the example shown below have been shortened.
Import
To import signal entries, right-click anywhere on signal entries and select the Import menu item. A dialog box will appear as shown below to allow selection of a comma separated values (csv) formatted file.
Rule Monitoring
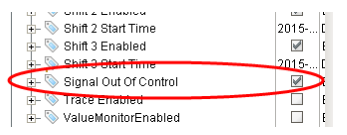
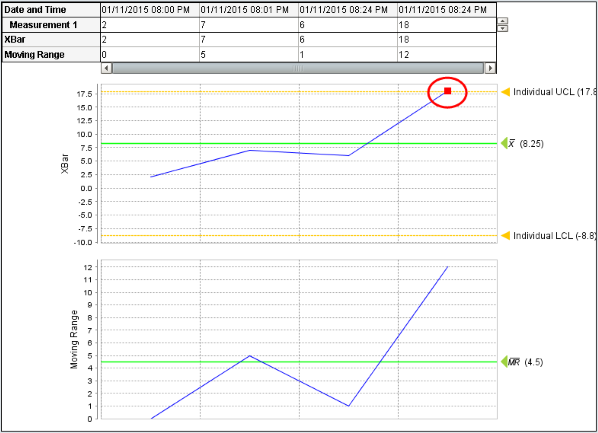
Typically, SPC software requires that someone opens a screen and visually checks for out of control conditions. Just like the scheduling of samples, someone may be distracted by other pressing production issues and fail to complete the task. The Sepasoft SPC module has powerful features that will automatically evaluate out of control signals every time new sample data is recorded. This can be expanded to instantly inform all parties that should know of various out of control conditions. Any sample that goes out of control will cause the Signal Out of Control tag to go to true and will show up in the control chart. Depending on the rule you will see a colored shape on every point that is out of control.
The SPC module provides an Signal Out of Control tag that goes to true when an out of control condition is detected.
You can configure an alarm on this tag to notify people when the sample goes out of control.
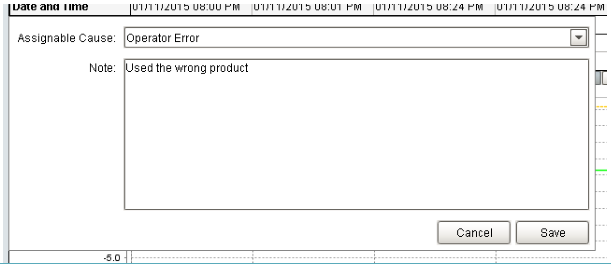
If you pull up the control chart, you will see an indication of the out of control sample. You have the ability to right click on the point and assign a cause and enter in a note.
Keep in mind that you only get one set of tags per location which will show the signal out of control, if any of the sample definitions are out of control.
Sepasoft MES Module Suite