Sepasoft MES Module Suite
A Complex Data Type Parameter is a flexible method for holding array data within a chart. They are created in the Start Block and can be accessed via scripting in the Script Block, and are also available for mapping connections in the Enclosing Chart, BAPI Action and RFM Action blocks. Data can be passed into and returned from charts by the chart execution functions here: system.mes.bc. The chart.getParameterValue() function will return a Complex Data Type Parameter object with several methods available for data manipulation.
Creating a Complex Data Type Parameter
Complex Data Type Parameters are created in the Start Block of any chart.
Create or Edit a New Data Type Parameter
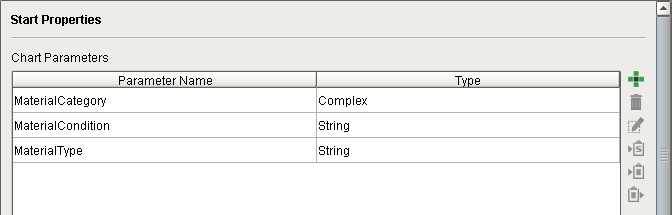
Chart Parameters are created and edited in the Start Block's Start Properties pane:
Rules Regarding Complex Data Type Parameters

|
|
To create a new Chart Parameter, click ![]() .
.
Configure the Chart Parameter using the Edit Parameter dialog box.
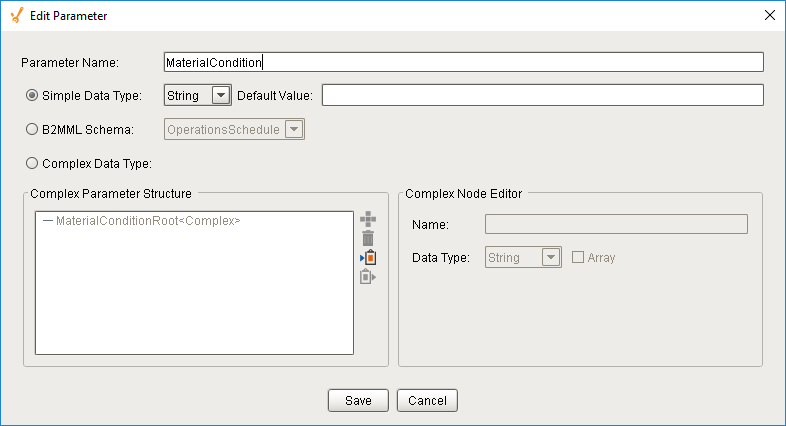
- Name the new parameter in Parameter Name (refer to naming rules above).
- Select the Complex Data Type radio button.
- Click on the name of your new parameter in the Complex Parameter Structure area.
- Click
 to add a row. Name it and select the Data Type in the Complex Node Editor area on the right. For an array instead of a list, select "Complex" from the Data Type drop-down. This will make this entry eligible for child elements.
 - Complete the list or array as needed.
- Click Save to save the parameter (or Cancel to quit the edits).
Naming Rules
|
|
Naming must conform to XML naming rules. Element names:
Also:
|
Object Functions
The chart.getParameterValue() function will return a Complex Data Type Parameter as a Pythonic object (dictionary, list, string, integer, real, etc., with type Date being represented in Ignition Date format). Therefore, the usual Python methods are available for data manipulation, such as:
.append()
Appends an element to a Pythonic List. Note that indexing begins at '1' instead of '0'.
Code Snippet
Code |
|
Before
Code |
|
After
Code |
<?xml version="1.0" encoding="UTF-8"?> <A> <B> <C>five</C> <C>six</C> <C>nine</C> </B> <B> <C>simple</C> <C>four</C> </B> </A> |
.remove()
Removes an element from a Pythonic List. Note that indexing begins at '1' instead of '0'.
Code Snippet
Code |
|
Before
Code |
<?xml version="1.0" encoding="UTF-8"?> <A> <B> <C>five</C> <C>six</C> <C>nine</C> </B> <B> <C>simple</C> <C>four</C> </B> </A> |
After
Code |
<?xml version="1.0" encoding="UTF-8"?> <A> <B> <C>five</C> <C>six</C> <C>nine</C> </B> <B> <C>simple</C> </B> </A> |
Example 1
In this example chart, the Iteration Block, Decision Block and Aggregation Block have the ability to utilize Chart Parameters with 'Complex Array' parameter nodes created in the Start Block.
The following example showcases a typical Chart Parameter with complex array parameter nodes, named NestedArray, which is comprised of a root (NestedArrayRoot), a child element (A[ ] ) of type 'Complex Array', and an array of type 'Integer' (B[ ] ) as child of that. It is being fed a value from the calling button script. The chart iterates through each of the four A[ ] elements, and for each one, iterates through all four B[ ] elements.
Start Block
The root level of the Chart Parameter, NestedArray, is created by default. It is empty and requires one or more child elements to be useful.
Child element A[ ] is created as 'Complex Array' since the Array checkbox is checked. This creates an iterable series of empty array elements, starting at 0.
Child element B[ ] is created under A[ ] as data type 'Integer Array' (since the Array checkbox is checked) to hold data values. It is not set as type 'Complex Array' because that would make it an iterable series of empty array elements which would require at least one of its own child elements to hold data values.
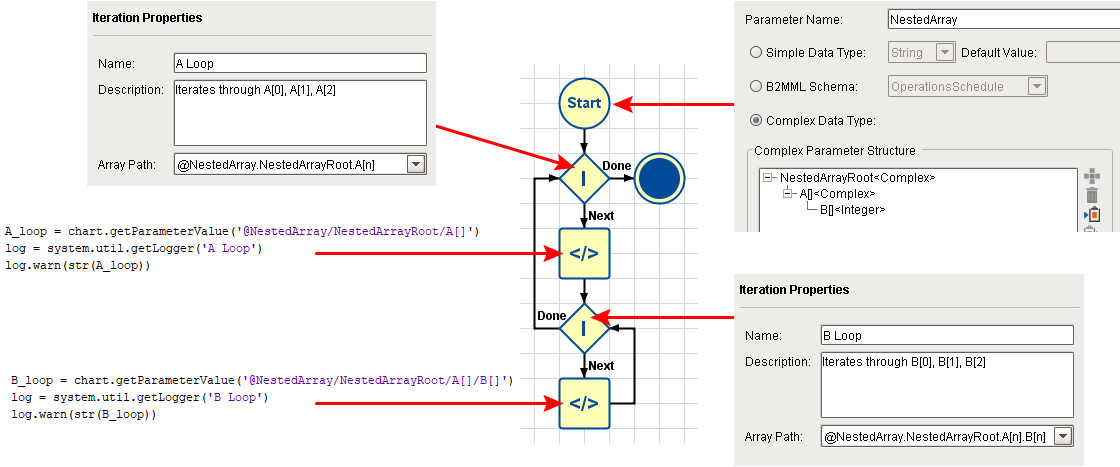
Iteration Block: A Loop
This block loops through each instance of the empty complex array element node A[ ], starting with 0.
Note that there are two choices in the drop-down Array Path menu, one for each level of the array. The first is for the empty complex array element node, A[ ], and the second is for the integer array, B[ ]:
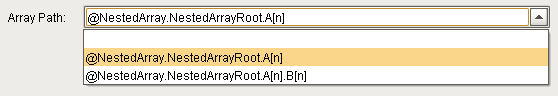
Array Path selection for "A Loop" Iteration Block
Script Block: A Loop
This script merely outputs the current value of A[ ] to the Ignition gateway Log. In this example, each instance of A[ ] contains a dictionary of that element's associated integer array, B[ ]:
A[0] → {'B' : [0, 1, 2]}
A[1] → {'B' : [10, 11, 12]}
A[2] → {'B' : [20, 21, 22]}

Log output for "A Loop" Script Block (in this example, for A[0])
Iteration Block: B Loop
This block loops through each instance of the integer array element B[ ] at the current instance of A[ ], starting with 0.
Note that there is no longer two choices in the drop-down Array Path menu. The empty complex array element node, A[ ], has already been claimed by the first Iteration Block, leaving only one remaining choice (the integer array, B[ ]).
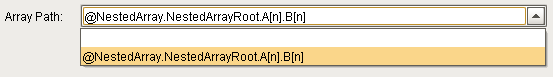
Array Path selection for "B Loop" Iteration Block
Script Block: B Loop
This script merely outputs the current integer value of B[ ] at the current instance of A[ ], to the Ignition gateway Log. In this example, each instance of B[ ] contains a series of integers previously assigned by the button script:
A[0] / B[0] → 0
A[0] / B[1] → 1
A[0] / B[2] → 2
A[1] / B[0] → 10
A[1] / B[1] → 11
A[1] / B[2] → 12
A[2] / B[0] → 20
A[2] / B[1] → 21
A[2] / B[2] → 22
Log output for "B Loop" Script Block (in this example, for A[0])
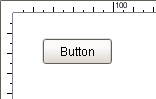
Button Script
A window with a single Ignition Button component is used to:
- Name the chart to be executed (Nested Iteration).
- Assign integer values to each instance of integer array B[ ] in Chart Parameter NestedArray.
- Pass in NestedArray and execute the chart Nested Iteration.
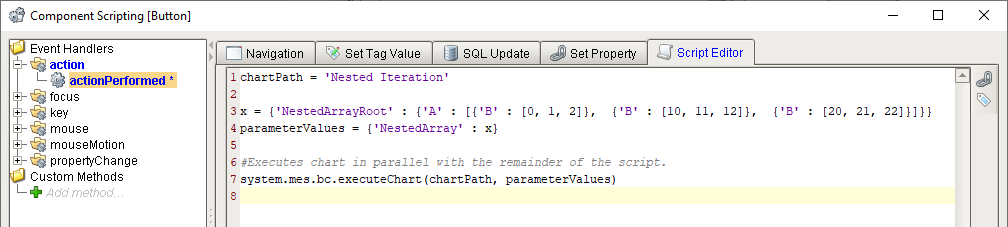
Ignition Button script on window
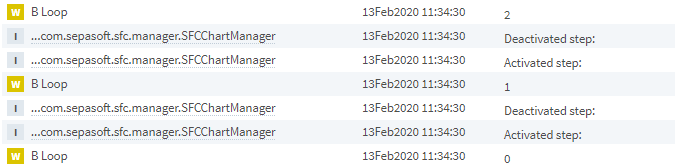
Log Output
The Ignition gateway Log records the output from the two Script Blocks that use logger commands to write out the current values of A[ ] and B[ ] per the nested chart execution sequence (remember: read from bottom upwards).

Sepasoft MES Module Suite