Sepasoft MES Module Suite
Charts
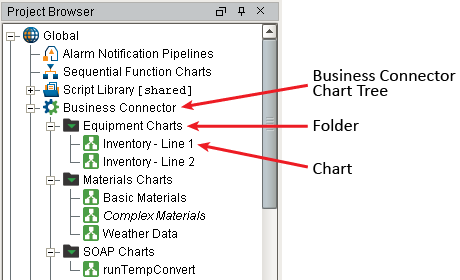
Charts reside in the Global section of the Ignition Designer under Business Connector or within (optional) folders created to organize collections of charts.

|
Be sure to Save your project after adding or making changes to folders or charts. |

|
Charts that have been edited will display italic names and require saving the project before exiting the Designer application. However, sometimes charts will display italic names due merely to internal property changes that occur when an Action Block is clicked (and saving is not required). |
Naming Characters Allowed
|
|
Names must begin with a letter, digit or underscore. Subsequent characters may also include spaces, dashes, underscores and parentheses. All other special characters, such as period, comma, colon, semicolon, all slashes, brackets and braces, as well as the special characters on the 1-8 keys, are not allowed. |
Create New Folder
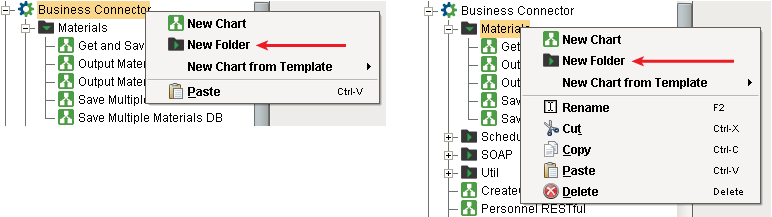
To create a new folder, navigate to the Global section in the Ignition Designer Project Browser, right-click on either Business Connector or an existing folder, then select New Folder. Name the new folder.
Create New Chart
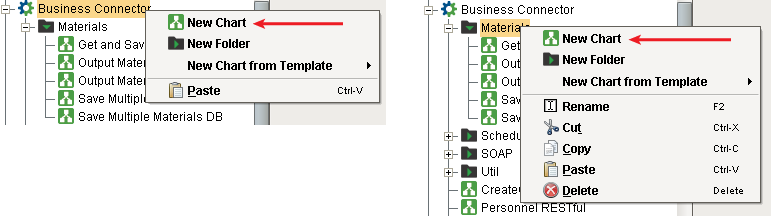
To create a new Business Connector Chart instance, navigate to the Global section in the Ignition Designer Project Browser, right-click on either Business Connector or a folder and select New Chart. Name the new chart.
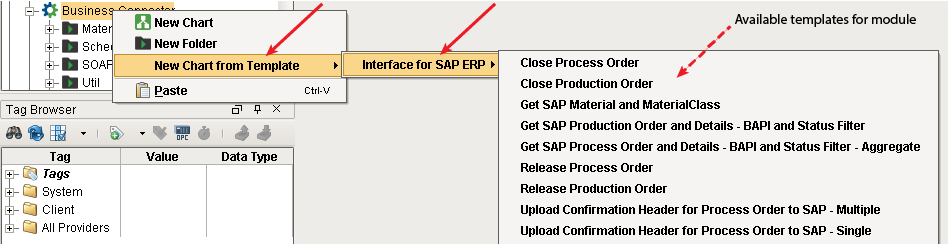
Pre-made charts ('templates') are also available with each Business Connector module, to cover a variety of basic functionality. Right-click on either Business Connector or a folder, select New Chart from Template, then the module (Interface for SAP ERP, in the example below) and then the desired template. A new chart, based on the selected template, will appear under Business Connector or the selected folder. Rename the new chart.
Move Folder or Chart
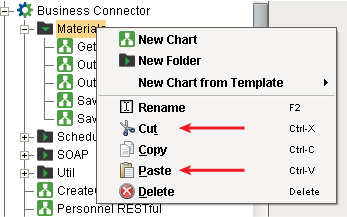
Folders and charts cannot be dragged in the Business Connector module. Use Cut (Ctrl-X) and then Paste (Ctrl-V) to relocate a folder or chart.
Cut folder or chart to move
Highlight the folder or chart in the Business Connector section, then right-click and select Cut (or use Ctrl-X).
Paste folder or chart into new location
Highlight either Business Connector or a folder, then right-click and select Paste (or use Ctrl-V). The item previously Cut will appear in the tree structure under the selected location.
Copy Folder or Chart
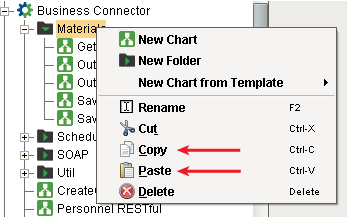
Use Copy (Ctrl-C) and then Paste (Ctrl-V) to make duplicate copy of a folder or chart. If a folder is copied, all the contents within it will also be copied (including subfolders and any charts they contain).
Copy folder or chart to duplicate
Highlight the folder or chart in the Business Connector section, then right-click and select Copy (or use Ctrl-C).
Paste duplicate folder or chart into new location
Highlight either Business Connector or a folder, then right-click and select Paste (or use Ctrl-V). The copied selection will appear in the tree structure under the selected location.
Rename Folder or Chart
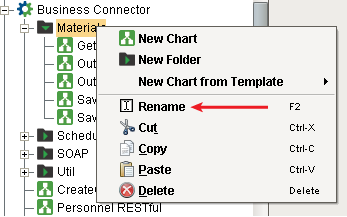
Highlight the folder or chart in the Business Connector section, then either right-click and select Rename (or press F2). Press Enter when done or ESC to cancel renaming.
Delete Folder or Chart
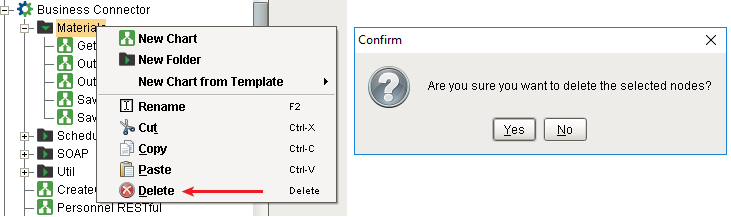
Highlight the folder or chart in the Business Connector section, then either right-click and select Delete (or press Delete). Click Yes to confirm.
Copy Path
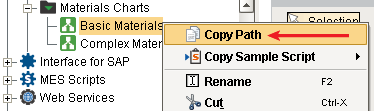
Highlight the chart in the Business Connector section, then right-click and select Copy Path. The chart's path will be copied to the clipboard.
Example, copied to clipboard: "Materials Charts/Basic Materials"
Copy Sample Script
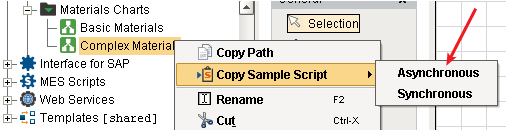
Highlight the chart in the Business Connector section, then right-click and hover over Copy Sample Script. Select either Asynchronous or Synchronous (refers to the type of script function. See Scripting Functions for details on which execute asynchronously versus synchronously). A sample script containing some of the lines of Python code required to complete your calling script (e.g. from an Ignition Button that launches chart execution) will be copied to the clipboard.
Examples of Script Copied to Clipboard
Sample of Script for Asynchronous Chart Function
Python |
chartPath = 'Materials Charts/Complex Materials' #Optional. Used to override default parameter values #parameterValues = None parameterValues = { 'maxRows' : 0, 'b2mml_materials' : '', 'rows_aggregated' : 0, 'rows_verify_no' : 0, 'rows_decision_no' : 0} #Executes chart in parallel with the remainder of the script. system.mes.bc.executeChart(chartPath, parameterValues) |
Sample of Script for Synchronous Chart Function
Code |
|
Exporting and Importing Charts and Destinations
Exporting Charts and Destinations
To export a Business Connector chart or SAP Destination:
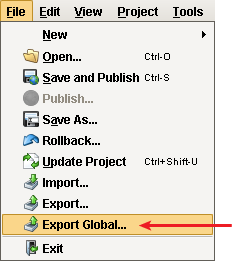
- Click File → Export Global (not Export)
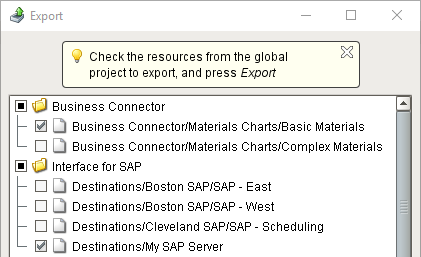
- Deselect all items in the Export dialog box and only re-select the charts and Destinations to export.
- Click Export and save to a folder (saves as an Ignition .proj file).
Importing Charts and Destinations
To import a Business Connector chart or SAP Destination (imports as an Ignition .proj file):
- Click File → Import.
- Select the .proj file and click Import. The charts and/or Destinations will appear in the Business Connector tree.
Sepasoft MES Module Suite