Sepasoft MES Module Suite
Impromptu SPC Analysis
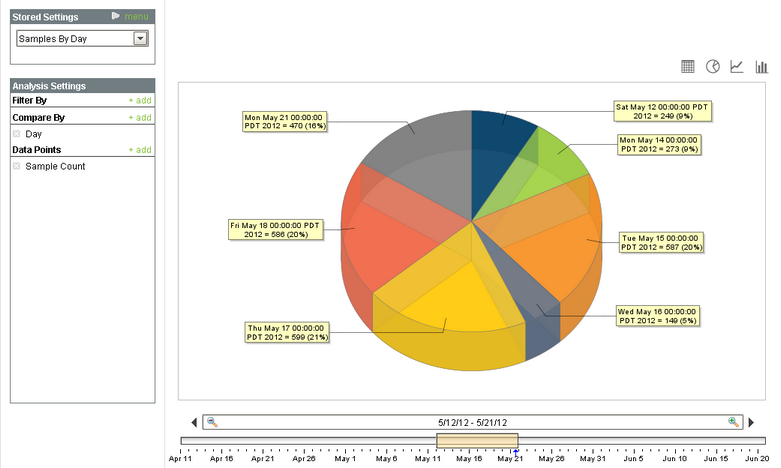
In addition to the Control Charts, the SPC module provides an impromptu SPC analysis screen allowing for free form analysis of production and quality data to help you zero in on the cause of quality related issues. This data can be filtered to include only specific criteria and comparisons can be made between different additional factors. For example, sample count by operator, or even process out of control conditions by operator and by shift, can be analyzed. You can select between the pie chart, bar chart, line chart, or tabular format for data analysis.
The date range selector at the bottom of the analysis screen is used to define the data range that will be included in the analysis. As you change the start or end dates, only the production runs that are within that range will be included in the analysis.
Stored Analysis
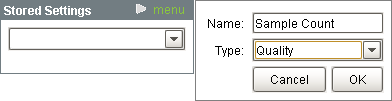
Start out by creating a new analysis by clicking on the menu of the Stored Settings panel and then selecting the New menu item. Next type in a name, select Quality for the type and click the OK button.
Filter By
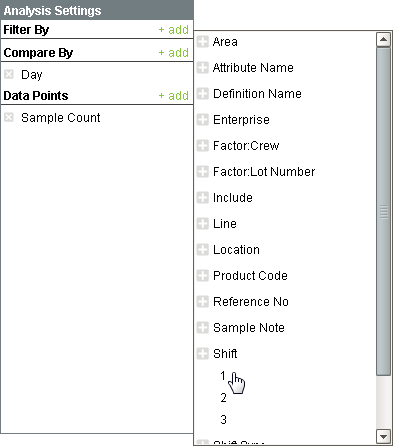
Once an stored analysis has been created or selected, you can change the selections to zero in on the data that is desired. The filter section allows you to limit the data that is included in the analysis. Filters can be added by clicking the Add icon the right side of the Filter By section. Within the popup filter selection window, scroll down to the Shift option and click the  icon. Notice the shifts can now be selected. Clicking on 1 for first shift will add the Shift = 1 causing the analysis results to included quality data for only for first shift. Any combination on filters can be added and the corresponding results will be shown.
The list of available filters change based on the date range. For example, if no samples were taken during the second shift, then a 2 will not appear as an available option under shift. Filter By items can be removed by clicking the 'X' located to the left of the filter name.
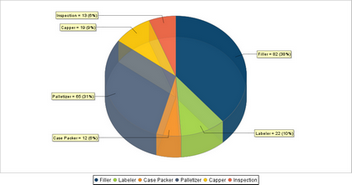
Compare By
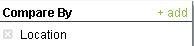
Breaking up information into groups is more meaningful than just seeing a total for a given date range. For example, knowing the total sample count for a given data range does not provide actionable information that can be used to improve quality. Now, comparing by the sample count for each person entering sample data may provide meaningful and actionable data that can be used to determine staffing requirements.
Additional Compare By items can be added by clicking the Add icon the right side of the Compare By section. Within the popup Compare By selection window, click on the item that you want to compare analysis results between.
Compare By items can be removed by clicking the X icon to the left of the name.
Data Points
Data points are the individual pieces of information that will be present in the analysis. For example, sample count or approved count are just two of the many available data points. To add a data point, click the Add on the right side of the Data Points section. Within the popup Data Point selection window, click on the data point item to include in the analysis.
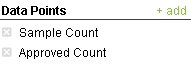
Data Points can be removed by clicking on the located to the left of the name. The pie chart will only show one data point. For this reason if more than one data point is selected the bar chart, line chart or table must be selected to see all the selected data points.
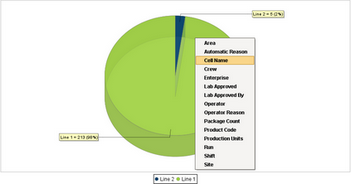
Drill Down
The drill down feature simplifies the compare by and filter selections. Click on a chart series to display the available drill down options. As shown in Drill Down Example 1 below, clicking on the Line 1 Quality pie segment will show a popup menu of drill down options. If the Shift option is selected, then the analysis filters will show the information by Shift and the Filter By and the Compare By sections add Shift. The result is shown in Drill Down Example 2. Again, by clicking on the pie segment and selecting another drill down option, the Filter By and Compare By selections will change to show the appropriate information. This can be continued any number of times.
Using SPC Data in your Reports
The impromptu analysis allows you through the client window to access and aggregate data in a meaningful way. the same data can be accessed through scripting and through the SPC analysis controller component to return the required dataset to be passed to the Ignition report designer to push to a third party reporting tool.
Sepasoft MES Module Suite