---
title: "SPC Histogram Chart - Perspective"
id: "spc-histogram-chart-perspective"
project: "MES User Manual"
url: "https://docs.sepasoft.com/articles/user-manual/spc-histogram-chart-perspective"
updated: 2026-07-31T14:56:34Z
---
# SPC Histogram Chart \- Perspective
**Sepasoft MES Module Suite**
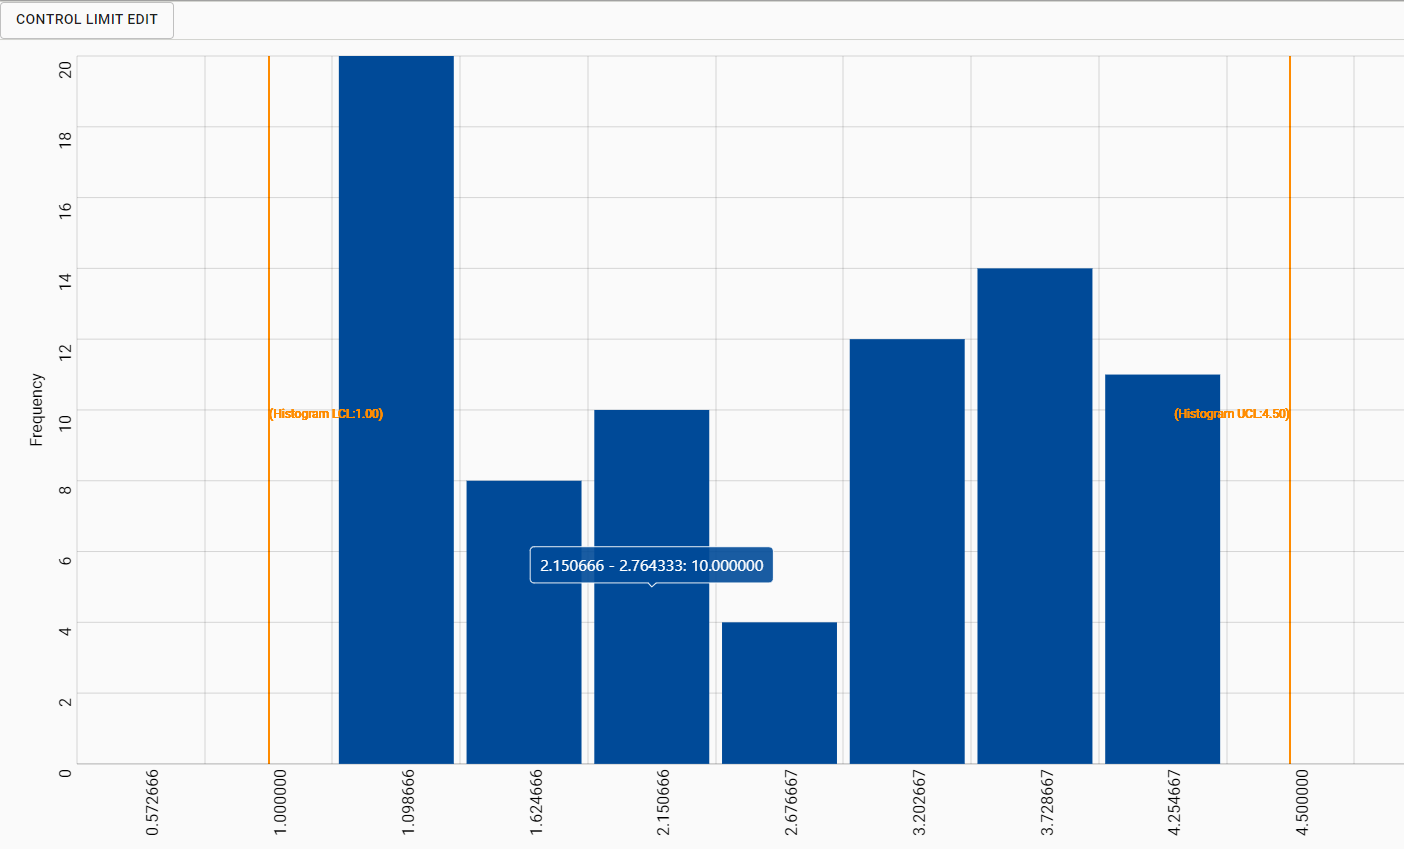
The Histogram chart is used to display frequency distribution of sample measurements. Different from control charts that present a picture of how a process varies over time. Histograms, on the other hand, present a picture of how the process "stacks up" over time. Histograms illustrate how many times a certain data value or range of data values occurred in a given time frame. Histograms reveal the distribution of data values, compare them with specification limits, and generate useful metrics and statistics that describe the data set in detail.
Included in Sepasoft Versions:
|  | MES 3.81.7 RC1 and later |
| --- | --- |
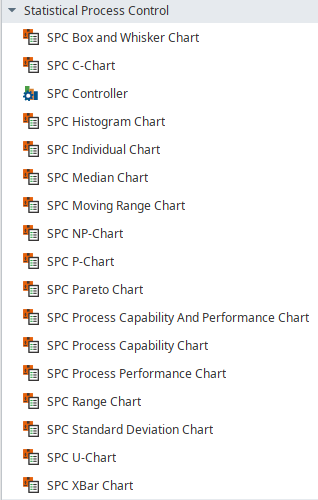
**Ignition DesignerPerspective Component Palette**
* * *
### Component Properties
Properties are provided that can be set to affect the operation and look of the component. They can be set through the **Property Editor in the Designer** or through scripting.
```python
self.getSibling("Histogram").noDataMessage = "No data message"
```
## SPC Perspective Chart Dataset Properties
These properties are available in the Ignition Properties Palette for SPC Charts.
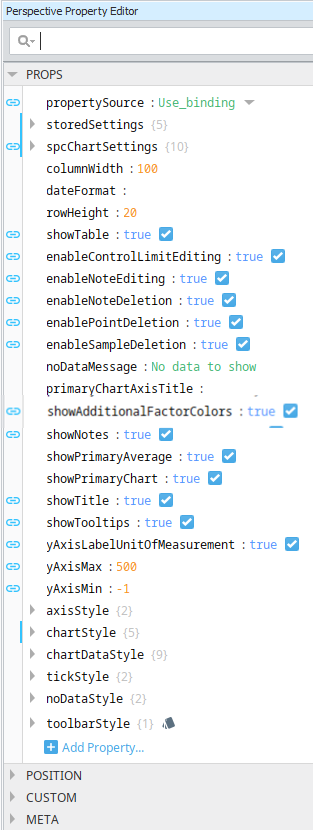
| **Property Source** |
```
propertySource
```
| Sets the datasource mode. Toggle two options: **Use\_stored\_settings** | **Use\_binding**
Included in Sepasoft Versions:
|  | MES 3.81.7 RC1 and later |
| --- | --- |
**Use\_stored\_settings:** Sets the chart to receive data from Stored Settings. **To use this, enter property values under storedSettings, see below**.
**Use\_binding:**Sets the chart to receive data from an SPC Controller. **To use this, bind to an SPC Controller under spcChartSettings, see below.**
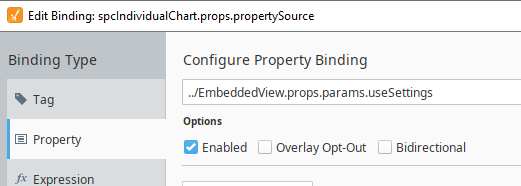
When clicking the binding icon on the left side of the propertySource, the Configure Property Binding dialog appears.
 |
| --- | --- | --- |
| **Stored Settings** | storedSettings | Set property values here when **propertySource** is set to **Use\_stored\_settings** |
| | | | **Property Name** | **Data Type** | **Property Value Description** |
| --- | --- | --- |
| storedSPCName | String | **Required when propertySource = 'Use\_stored\_settings':** Sets name of the Stored SPC Setting. The name must match exactly to the name you enter in Stored SPC Selector.
|  | Stored SPC Selector component only offered in VISION.
See [Stored SPC Selector | Vision](/articles/user-manual/stored-spc-selector-vision) |
| --- | --- | |
| location | String | **Optional:** Filter on a Location that is defined in Equipment Manager. Enter the Equipment Path to the Location. |
| startDate | Date | **Required:** Sets start date to filter SPC data on
|  | Bind to form fields on the view to make dates selectable in runtime. |
| --- | --- |
**Required:** Sets end date to filter SPC filter on |
| endDate | Date |
| autoRefresh | Boolean | True/False **Required**: True, refreshes data when sample or definition information changes. **Set to True to use real-time data.** | |
| **SPC Chart Settings** | | spcChartSettings
**** Set property values here when **propertySource** is set to **Use\_Binding**
**Bind to the SPC Controller** |
| | | | **Property Name** | **Data Type** | **Information** |
| --- | --- | --- |
| storedSPCName | String | Incoming property value from the SPC Controller > Stored Setting. |
| startDate | Date | Sets start date to start filtering data on |
| endDate | Date | Sets end date to filter data on |
| autoUpdate | Boolean | Required True/False: True, updates data when a sample is taken. Use for realtime data. |
| autoRefresh | Boolean | Required True/False: True, refreshes data when sample or definition information changes. Use for realtime data. |
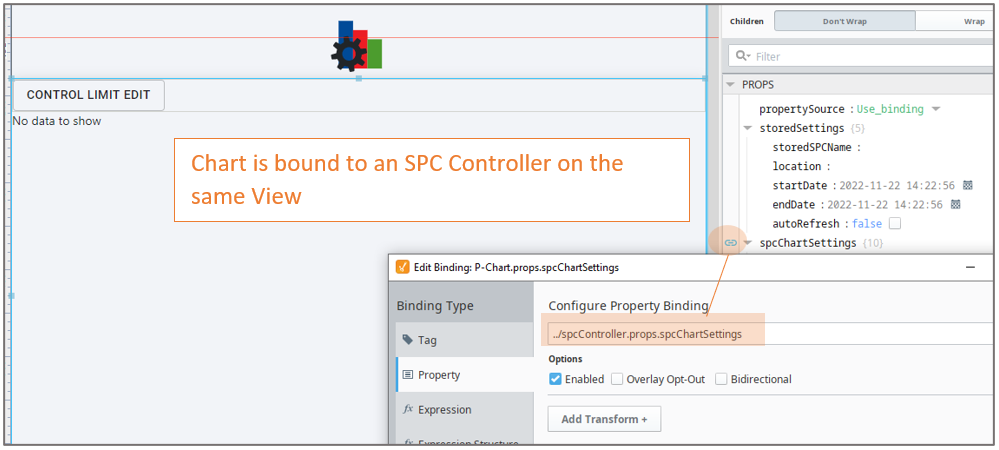 |
| | | **settings**
| **additionalFactors**: | String - Additional factors to include in the SPC chart. |
| --- | --- |
| **attributeName:** | String - Name of the sample attribute |
| **attributeUnits**: | String - Adds a label for the unit of measure for the sample |
| **boxAndWhiskerFilter**
Chart Specific | String - Box and whisker filter items to filter on. |
| **controlLimits:** | String - Summarizes control limits to add to the chart |
| **definitionName:** | String - Name of the sample definition. |
| **filters:** | String -
**location:** The Location Path defined in the Equipment Manager to filter on.
**factors:** Properties >Additional Factor
Filter on existing additional factors |
| **measurement:** | String - Measure number to filter on |
| **nonconformingFilter**
Chart Specific | String - Nonconforming items to filters on |
| **nonconformityFilter**
Chart Specific | String - Nonconformity items to filters on |
| **paretoFilter**
Chart Specific | String - Items to include in a Pareto chart. |
| **rowLimit:** | ****String - The maximum number of samples to return in the results. |
| **signals** | String - Summarizes your signal selections in a string. |
| **spcDataFormat:** | String - SPC Data
|  | Each chart type has specific settings. Select the correct chart from the dropdown menu. |
| --- | --- | |
| **useDefaultChartTyp** **e:** | String - If true, uses the default chart type from the attribute definition. |
| **useDefaultChartTyp** **e:** | String - If true, uses the default chart type . |
| **enableFutureLimitEditing:** | String -If true, you can set limits for future (non-existing) samples. | |
| | | **histogram**
| **autoBarCount**: | Boolean - If true, the number of data bars that are displayed is calculated automatically. |
| --- | --- |
| **dataBarCount** | int - The number of data bars to display when **autoBarCount** is False. |
| **paddingBarCount** | int - The number of bars prior to and following the data bars to include in the histogram results. | |
| | | **dynamic**
When using an SPC Controller to populate a Perspective SPC Chart, these dynamic filters can be used to filter the data for display in a chart.
| **factor** | String - Additional factors that were recorded along with the sample. |
| --- | --- |
| **location** | String - The location path where the samples were collected. |
| **productCode** | String - Samples returned should have this Product Code if present. |
| **referenceNo** | String - Samples returned should have this Reference Number if present. |
| **sampleApprovedBy** | String - The username of the user that approved the samples. |
| **sampleTakenBy** | String - The username of the user that recorded the samples. |
| **shift** | String - A schedule shift during which the samples were taken. | |
| | | **spcResults**
SPC Results including data, measurement count, messages and calculated value information.
**definitionUUI**
- calcValueList
- defaultChart
- measureFormat
- unit
**measurementCount**
- messages
- errormessage
- warningMessage
**spcData: dataset - The SPC data.** | |
| **showTable** | Boolean | Enable to display the data table. The table is updated as new data comes in. | |
| Scripting Reference | Description | Description | Description | |
| --- | --- | --- | --- | --- |
| **xAxisVerticalTickLabels** | **Boolean** | Set to True to show labels of the vertical tick marks on the x axis. |
| **enableControlLimitEditing** | **Boolean** | Set to True to allow end-users to edit control limits |
| **vertical** | **Boolean** | Set to True to set the chart in a vertical orientation. |
| **noDataMessage** | **String** | The message to show when there is no data returned. |
| **valueAxisTitle** | **String** | Title to show for the value axis. |
| **frequencyAxisTitle** | **String** | Title to show for the frequency axis. |
| | **chartDataStyle** | |
| --- | --- | --- |
| | | **barColor** | Color, picker available | Sets the color of the bars |
| | | **barSpacing** | Float | Spacing between bars as a percentage of the bar width. |
| | | **gradient** | Boolean | If true, bars are drawn with a gradient shine. |
| | | **shadow** | Boolean | If true, shows a shadow on the bars. |
| | **tickStyle** | | | | |
| --- | --- | --- | --- | --- | --- |
| | | **tickLabelColor** | Color, picker available | The color of the tick labels. |
| | | **tickLabelFont** | String | The font of the tick labels. |
| | **axisStyle** | |
| --- | --- | --- |
| | | **axisTitleColor** | Color, picker available | Color of the axis titles |
| | | **axisTitleFont** | Font Family | Sets the font for the axis titles |
| | **chartStyle** | | | | |
| | | **showHorizontalGridLines** | Boolean | If true, shows horizontal grid lines. |
| | | **horzGridLineColor** | Color, picker available | Sets the color of the horizontal grid lines on charts. |
| | | **chartBackground** | Color, picker available | The background color of the primary chart. |
| | | **showVerticalGridLines** | Boolean | f true, shows vertical grid lines on charts. |
| | | **vertGridLineColor** | Color, picker available | The color of vertical grid lines. |
### Meta Properties in the Perspective Property Editor
| Name
Scripting Reference | Data Type | Description | Description | Description |
| --- | --- | --- | --- | --- |
| **name** | String | Name of the component. Used in scripting and component tree paths by name, such as during Property Binding. |
| **visible** | Boolean | Whether or not this component should display. |
| **tooltip** | | |
| **enable** | Boolean | Whether the tooltip on hover |
| **width** | Integer | The height of the table rows. |
| **text** | String | The scroll bar x position. |
| **style** | Boolean | Toggle to show or hide the sample data table. |
| **delay** | Boolean | Image icon to show to edit control limits. |
| **sustain** | Integer | Time, in milliseconds, to display tooltip before removing it. A value of 0 results in the tooltip displaying until the mouse exits the components. |
| **location** | Boolean | The location where the tooltip displays. |
| **tail** | Boolean | Enables a decorative triangle on the tooltip that points to the tooltip owner. Ignored when location uses a value of 'mouse'. |
## Extension Functions
This component does not have extension functions associated with it.
Custom Methods
Custom methods allow you to add your own component functions to a component that can be called through scripting. This is a useful and clean method of re-using script that is specific to the component (say you want to update a visual aspect of the component in the same way whether a user clicks on the component or a window property value changes). See [Component Custom Methods](https://docs.inductiveautomation.com/display/DOC79/Custom-Component-Methods) in the Ignition Help Manual for more information.
Customizers
This component does not have any custom properties.
## Component Functions
Example of the component on the page root container:
**event.source.parent.getComponent('Box and Whisker Chart').showSetLimitPanel** **(True)**.
showSetLimitPanel
* Description
Causes the calculate and set control limit dialog to be shown.
* Parameters
Boolean - True/False
* Return
Nothing
* Scope
Client
**Sepasoft MES Module Suite**