Calling a Business Connector Chart
The ProductionOrderById view is located in the Perspective → Views → Tutorial → Named Query folder. We will now configure it to call your new business connector chart, which will call the getWeather consumer and display the results graphically using the Ignition Map component. Portions of the Perspective view have been pre-built to save time.
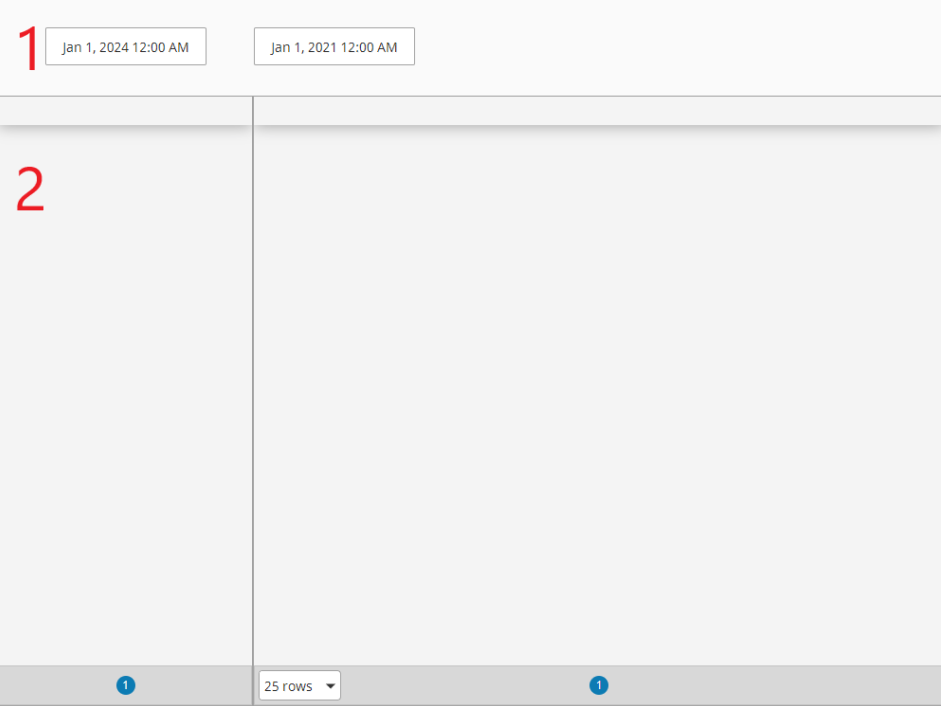
The ProductionOrderById view has two main components:
- Start and End date Date Input (Ignition)
- Tables (Ignition)
Configure Business Connector Chart to Execute Chart on Date Change
We will add value change scripts to the DateTime Input components' value property to execute the getAllProductionOrderIDs chart, which will execute the named query getProductionOrderIDs.
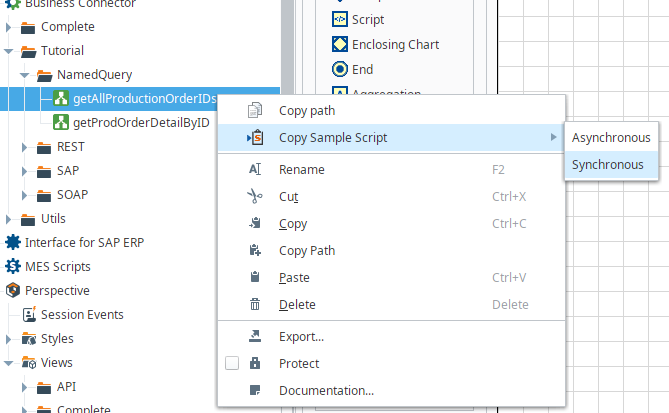
- Navigate to the Business Connector chart getAllProductionOrderIDs. Right-click on the chart name in the Project Browser and select Copy Sample Script → Synchronous, as shown to the right.
- Open the ProductionOrderById view in your Tutorial/Named Query folder. It has two DateTime Input components, one is the Begin Date and the other is End Date. Select Begin Date and find the value property to add a Change Script if the date changes.
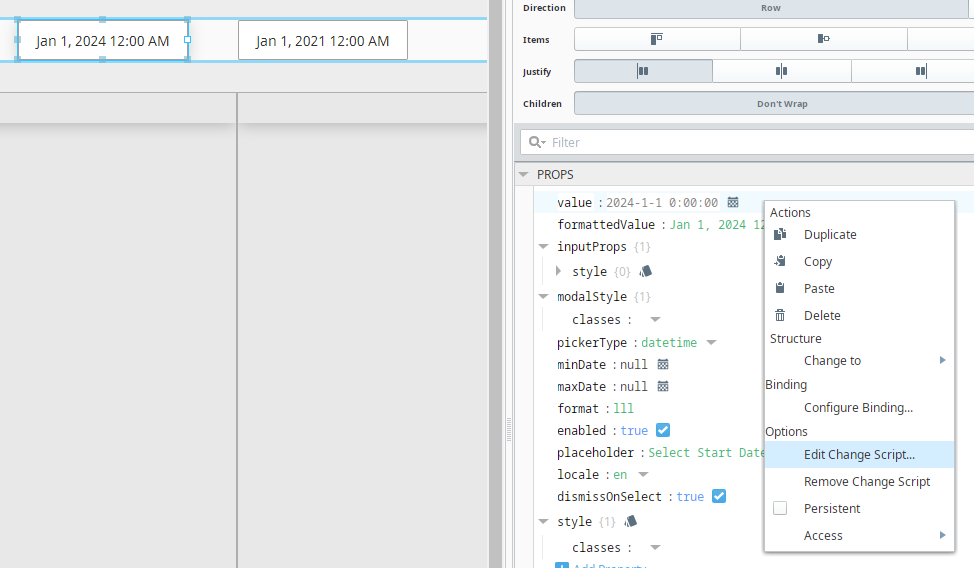
- Paste the Business Connector script in the Start Date and End Date valueChanged script block. The example below is the complete workflow to determine user input is valid, call the chart, and pass returned data to the table.
Start Date Value Changed
Python |
def valueChanged(self, previousValue, currentValue, origin, missedEvents): |
End Date is very similar, with a minor exception of the startDate and EndDate variable declarations.
End Date Value Changed
Python |
def valueChanged(self, previousValue, currentValue, origin, missedEvents): |
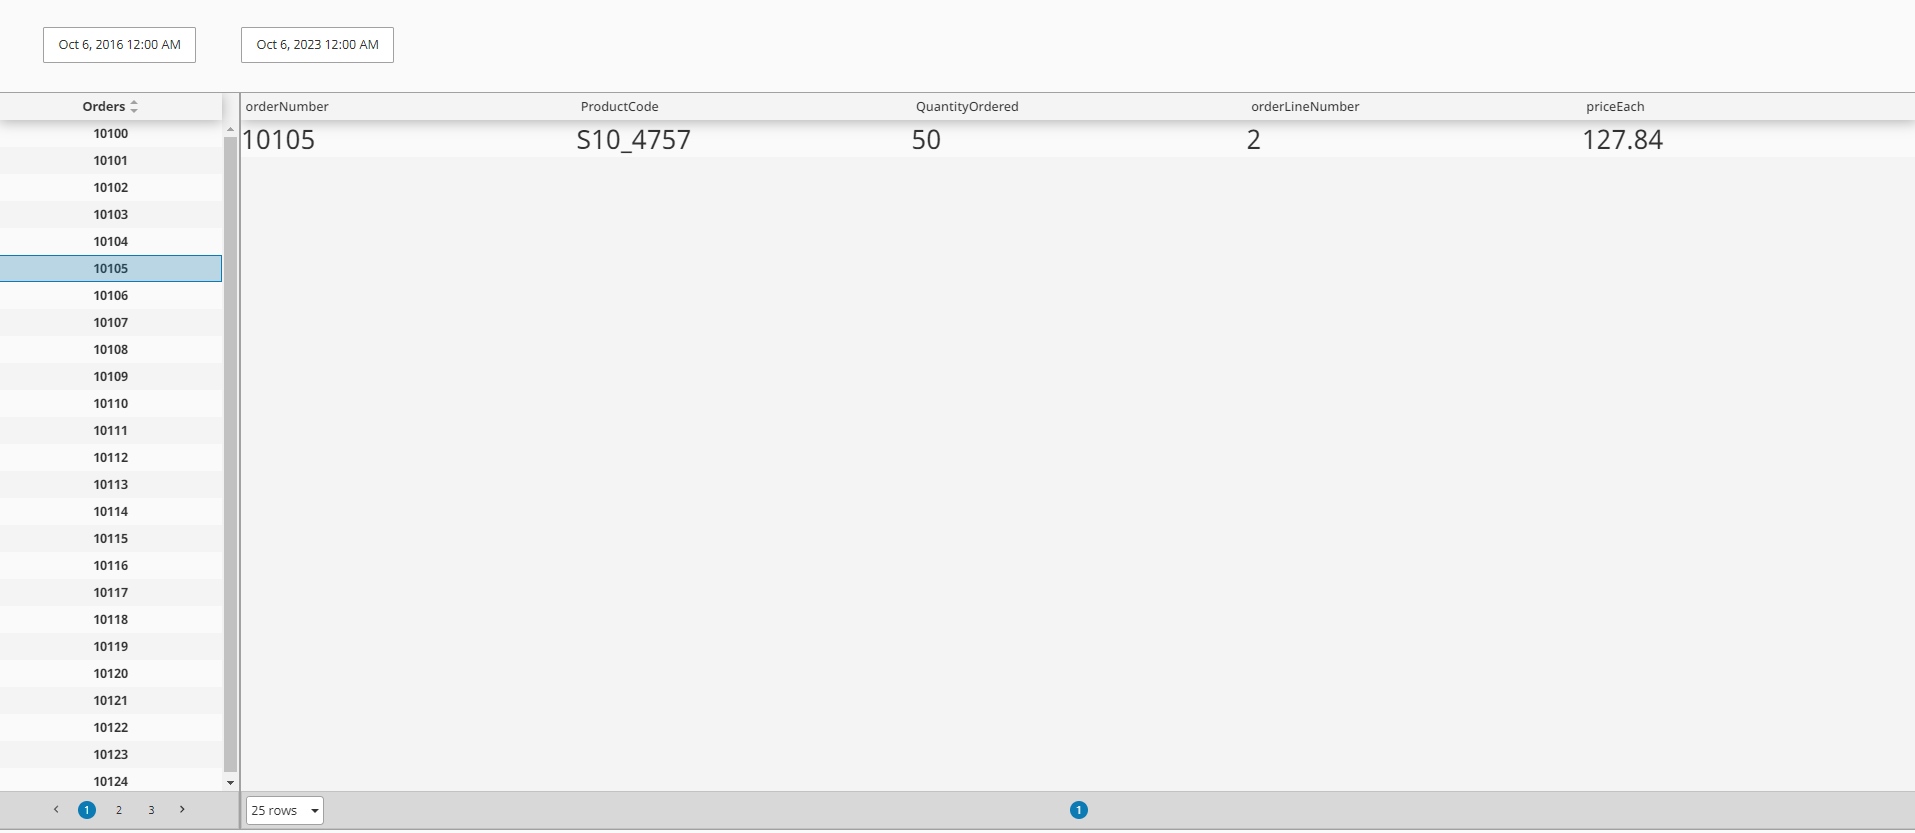
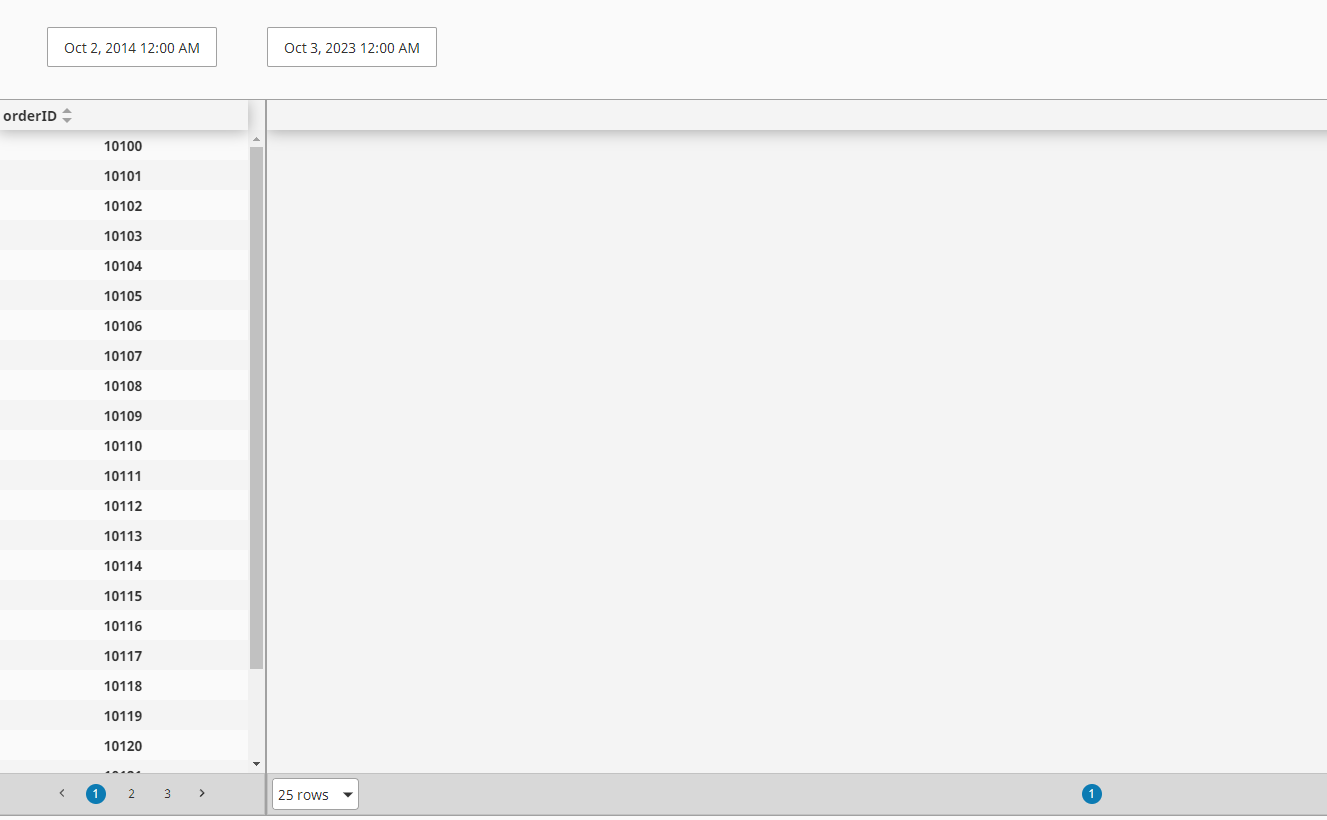
Launch a client and test by selecting a start and end date where orders are within the date range:
Configure Business Connector Chart to Execute Chart on Row Selection
For this section, you will configure the table of orderIDs to execute the getProdOrderDetailByID chart, passing in the order id to retrieve additional information. Result data will be populated in the right side table orderDetails
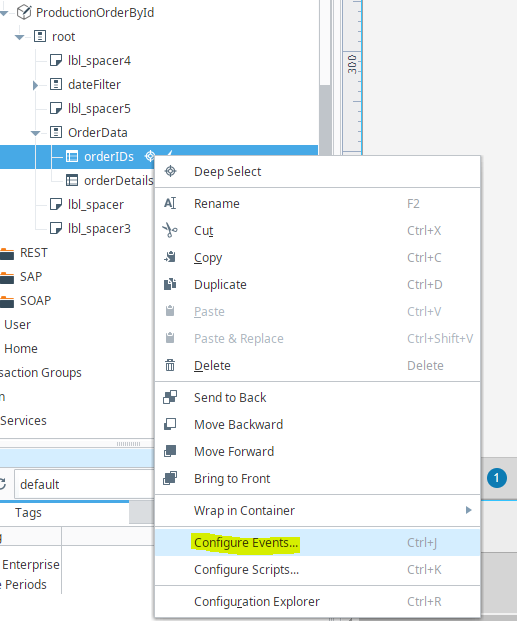
- Right-click on the orderIDs table in the project browser and Configure Events:
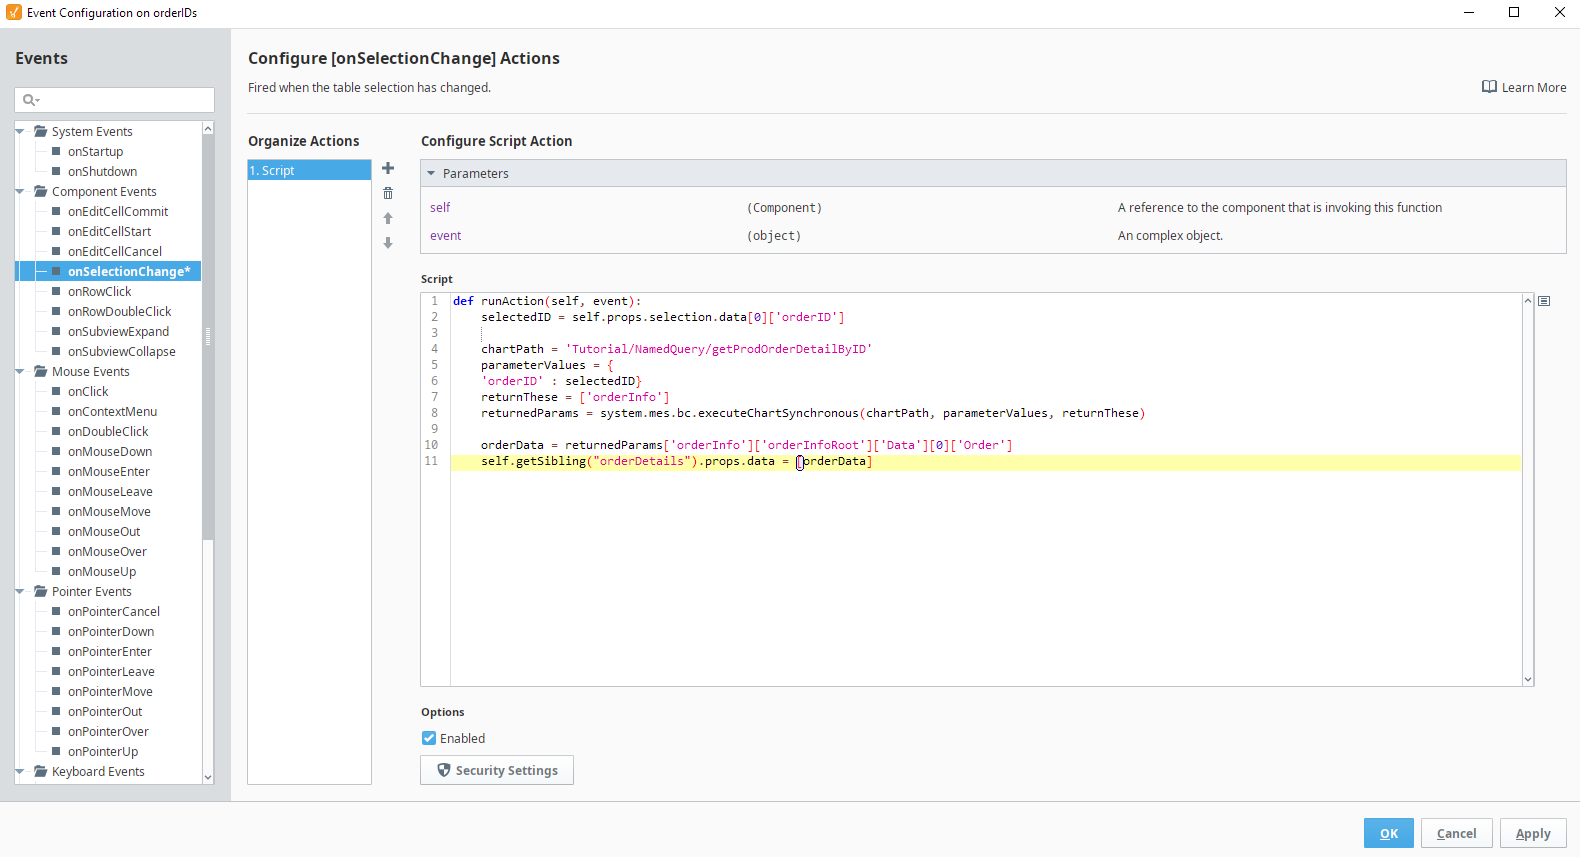
- In the onSelectionChange event, past in the following script:
onSelectionChange
Python |
def runAction(self, event): |
Save your project!
- Launch a client and test by selecting a start and end date where orders are within the date range:
- Select a row in the left table to execute the second chart and populate the right table with the results: