Running TagHistorianData
We will now select the number of minutes of data to average using the slider, then click the Call BC Chart button to execute the SOAP Consumer TagHistoryAverage, which then calls the SOAP Provider TagHistoryAverage. The results are displayed on the Ignition Table component.
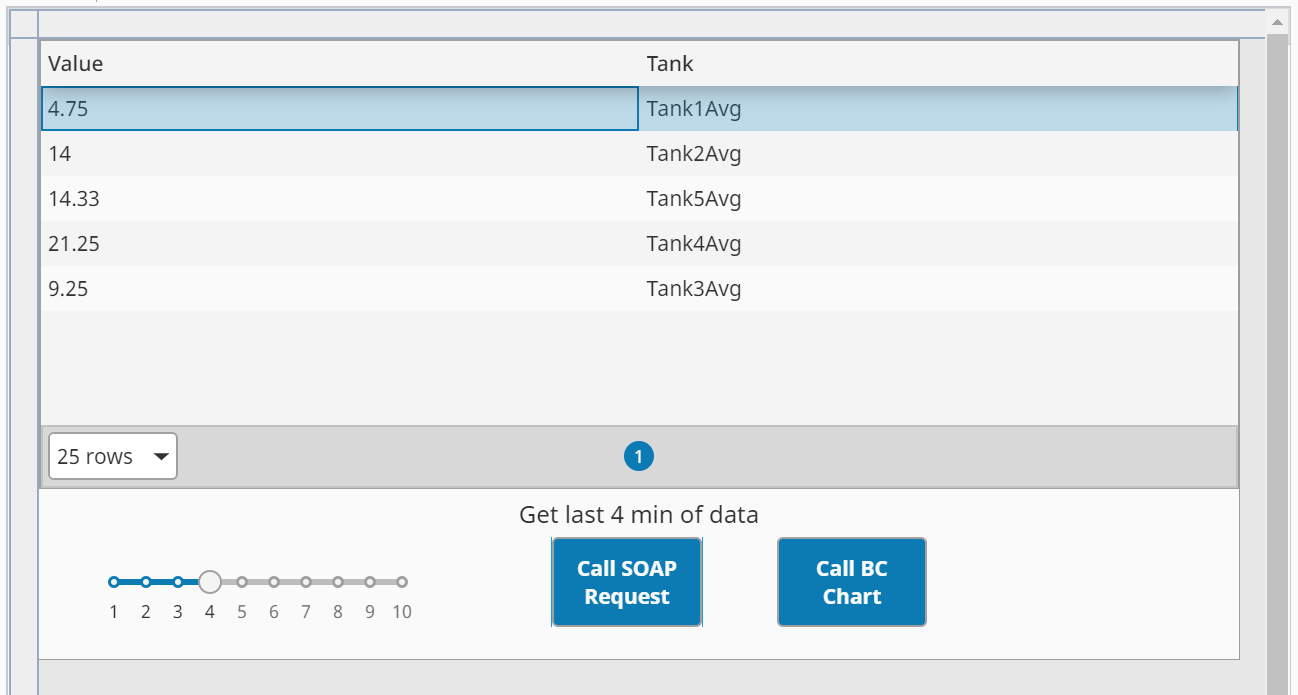
Run the TagHistorianData View
- Choose any value on the slider.
- Click the Call BC Chart button. The calculated averages for each of five simulated tanks will appear in the Table component.