Create a Production Control Screen
Complete the following steps using the 02_Production Control screen recently configured:
Perform Production Runs
- Perform a start production → end changeover → end production sequence below a few times, to experience the OEE Run Director operation life cycle, as follows:
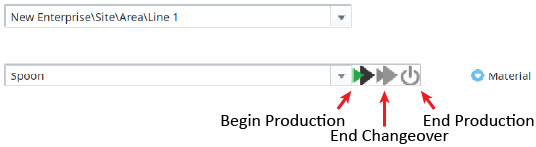
- Select the radio button labeled Material.
- Select Line 1 and a material (example: Spoon) to run on the line from the drop-down menus. Once a material is selected, The Begin Production button will become enabled.
- Expand Line 1 in the OEE Time Chart so you can see Cell A and Cell B.
- Click Begin Production and wait a few seconds. The run should appear as a yellow line on the OEE Time Chart. The End Changeover button will become enabled.
- Click End Changeover. The production line is now 'running'. The run should appear as a green line on the OEE Time Chart. The End Production button will become enabled.
- After a few seconds, click End Production. The production run is now ended and the Begin Production button will be enabled again for the next production run.
- Repeat the steps above several times with other materials and the other Line, to become familiar with the sequence.
Start another production run (any Line, any material), but this time allow the default changeover time to expire (default = 60 seconds). This will automatically start production and demonstrate the operation trigger functionality built in to OEE Downtime.

When the default changeover time expires, the End Changeover button becomes disabled and the End Production button becomes enabled.
End the production run.
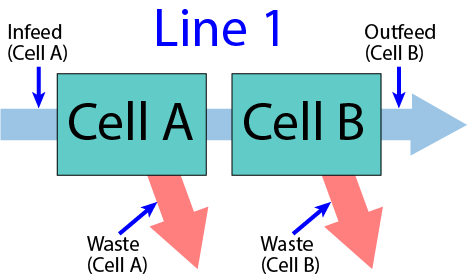
- Start another production run (any Line, any material) and end changeover. Open the Tag Browser to the Tags for Cell A and Cell B in the Line you're running (or use the optional Spinners and Numeric Text Fields created earlier). Change the Memory Tag values as described below, to simulate material moving through the two Cells of your production line:
- Increment the Infeed counter for Cell A, then increment the Outfeed counter for Cell B (one unit successfully manufactured).
- Increment the Infeed counter for Cell A, then increment the Waste counter for either Cell A or Cell B (unit rejected), to simulate a rejected part at one or the other Cell.
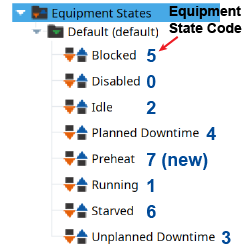
- Change the State tag for either Cell A or Cell B to another Equipment State that will cause the OEE calculations to drop (example: 2 for Idle, 6 for Starved, or use the new state you created earlier). Wait a few seconds then change it back to 1 again (Running).
- Repeat the above steps multiple times, to simulate your production line producing some successful parts, some rejected parts on both cells, and also cycling through several Equipment States besides 1 (Running) on the two Cells.
- End production. You should now have several successful units, several reject units and several states that the Cells went through before production ended. The more activity you simulate, the more 'interesting' data you will have for examining and reporting.


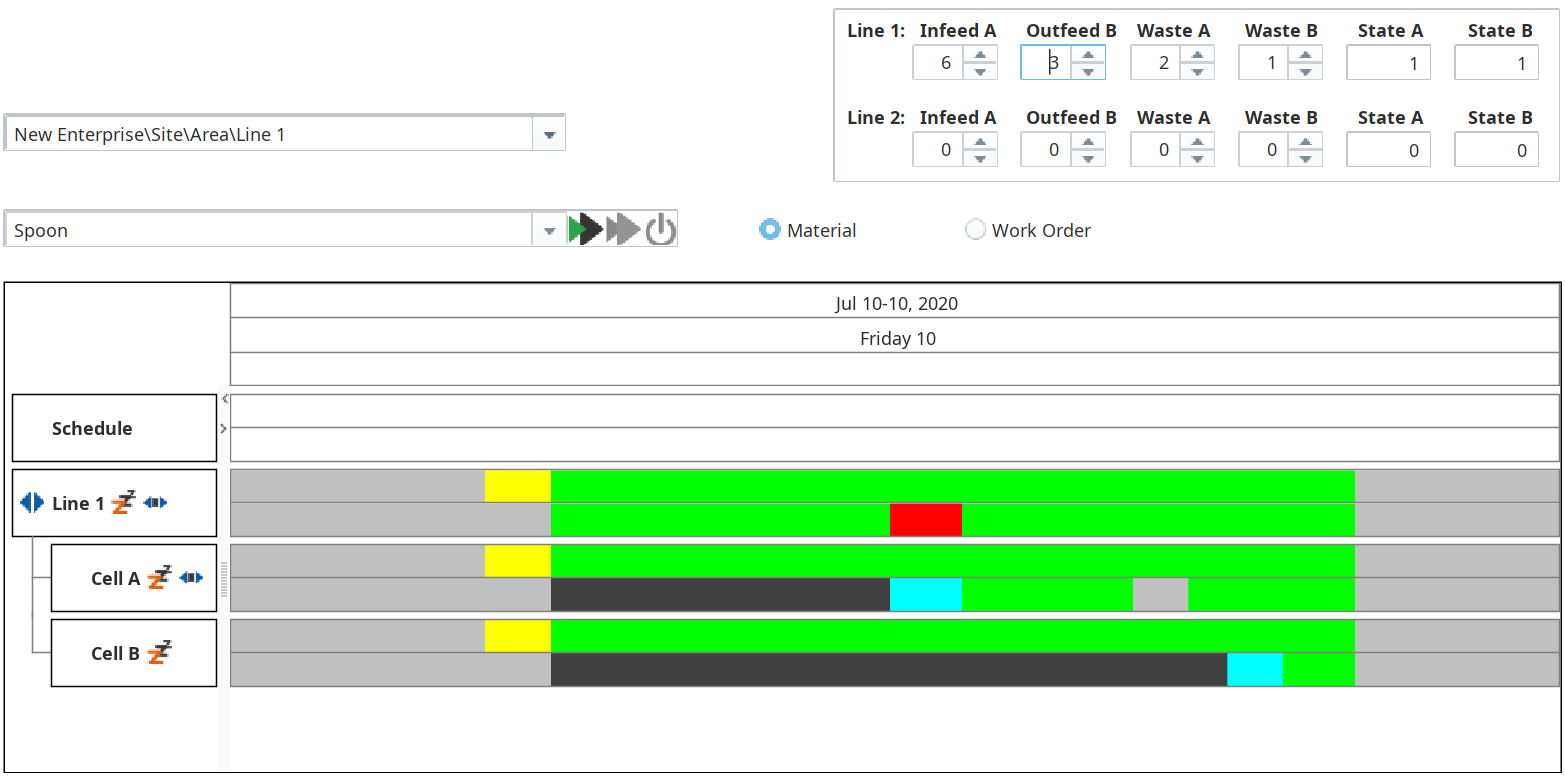
OEE Time Chart
(Line 1 running Spoon)
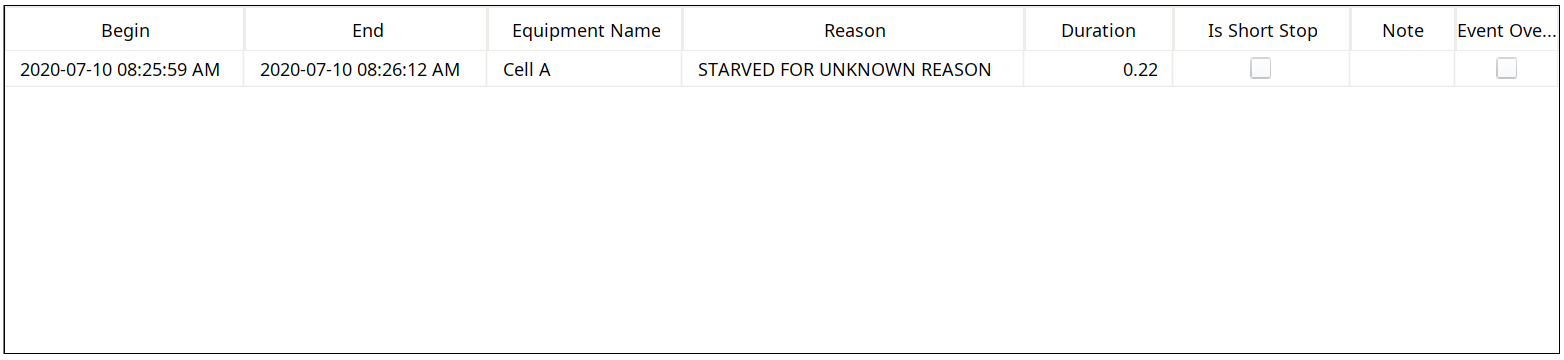
OEE Downtime Table
(Line 1 running Spoon)
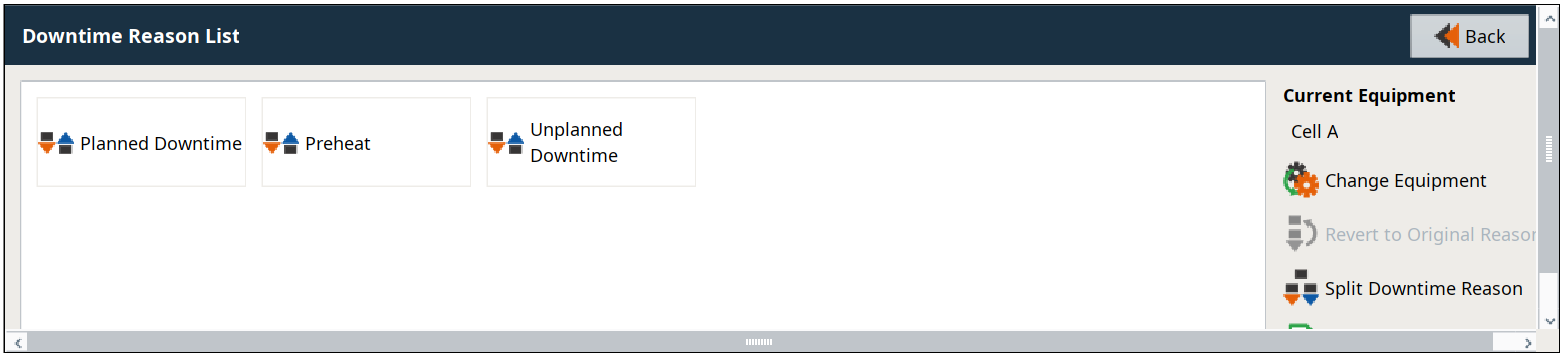
OEE Downtime Table
(Line 1 running Spoon)
(2nd row selected)
This is just one example of tracking and controlling production activity via a graphical user interface (GUI). By introducing this through the OEE Run Director, all users now have a simple way to start and stop production runs to quickly begin receiving viable OEE production tracking data right 'out of the box'.
Though very useful and easy to implement, this GUI-based interface does not suit all use cases, so additional methods and abilities are shown in other sections of the online OEE tutorial.