Run the Dashboard
Complete the following steps using the 04_Reporting screen recently configured:
Display an Analysis
- Put Designer into Preview mode.
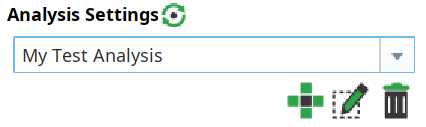
- In the Project Browser, click to select the MES Analysis Controller component for this screen (mac_Table). Change the Analysis Setting Name property to the name of one of the analyses you created previously (e.g. "My Test Analysis"). The Data Points, Filter By, Group By and Order By properties will auto-populate directly from the settings in the Live Analysis you entered. You'll see some data appearing in the bar chart and the table.
- Change the Start Date and End Date to adequately span the period of time when you were simulating production runs (so you'll have some data to see in this report screen).
Open the Analysis Selector page in the Options folder. Select My Test Analysis in the drop-down list.
Edit the Filter By entry in My Test Analysis to include both lines, as follows:
Filter By
CodeEquipment Path LIKE New Enterprise\Site\Area\*

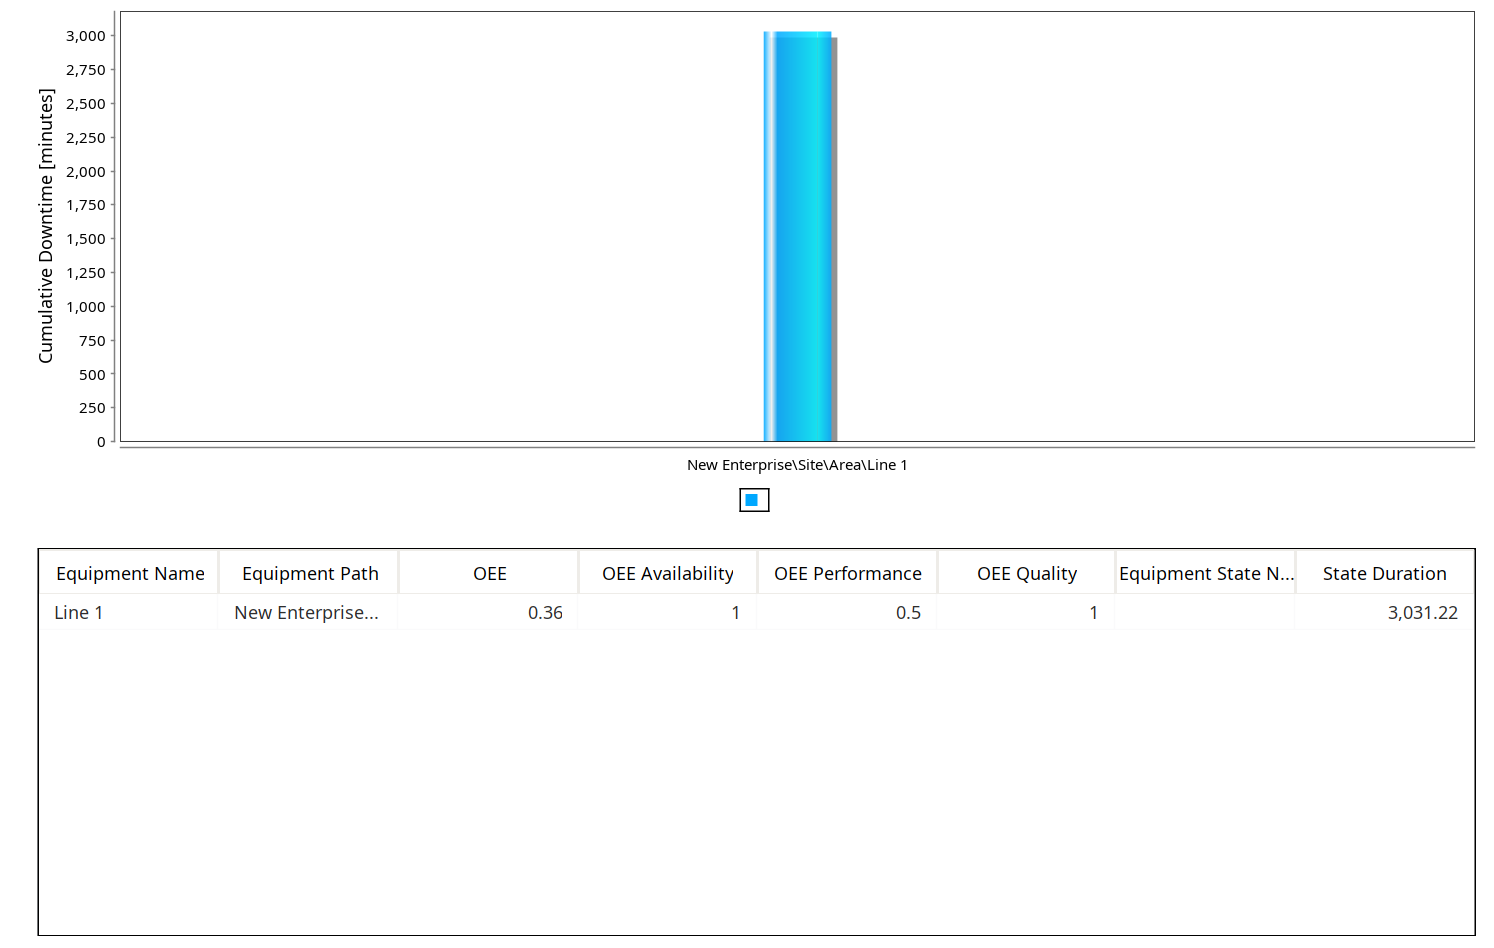
If Filter By is already set to the expression above (e.g. from the GUI lesson), then you'll already be seeing data for both Line 1 and Line 2. To see just Line 1, set the expression to "Equipment Path = New Enterprise\Site\Area\Line 1" and view the new results in your graph and table.
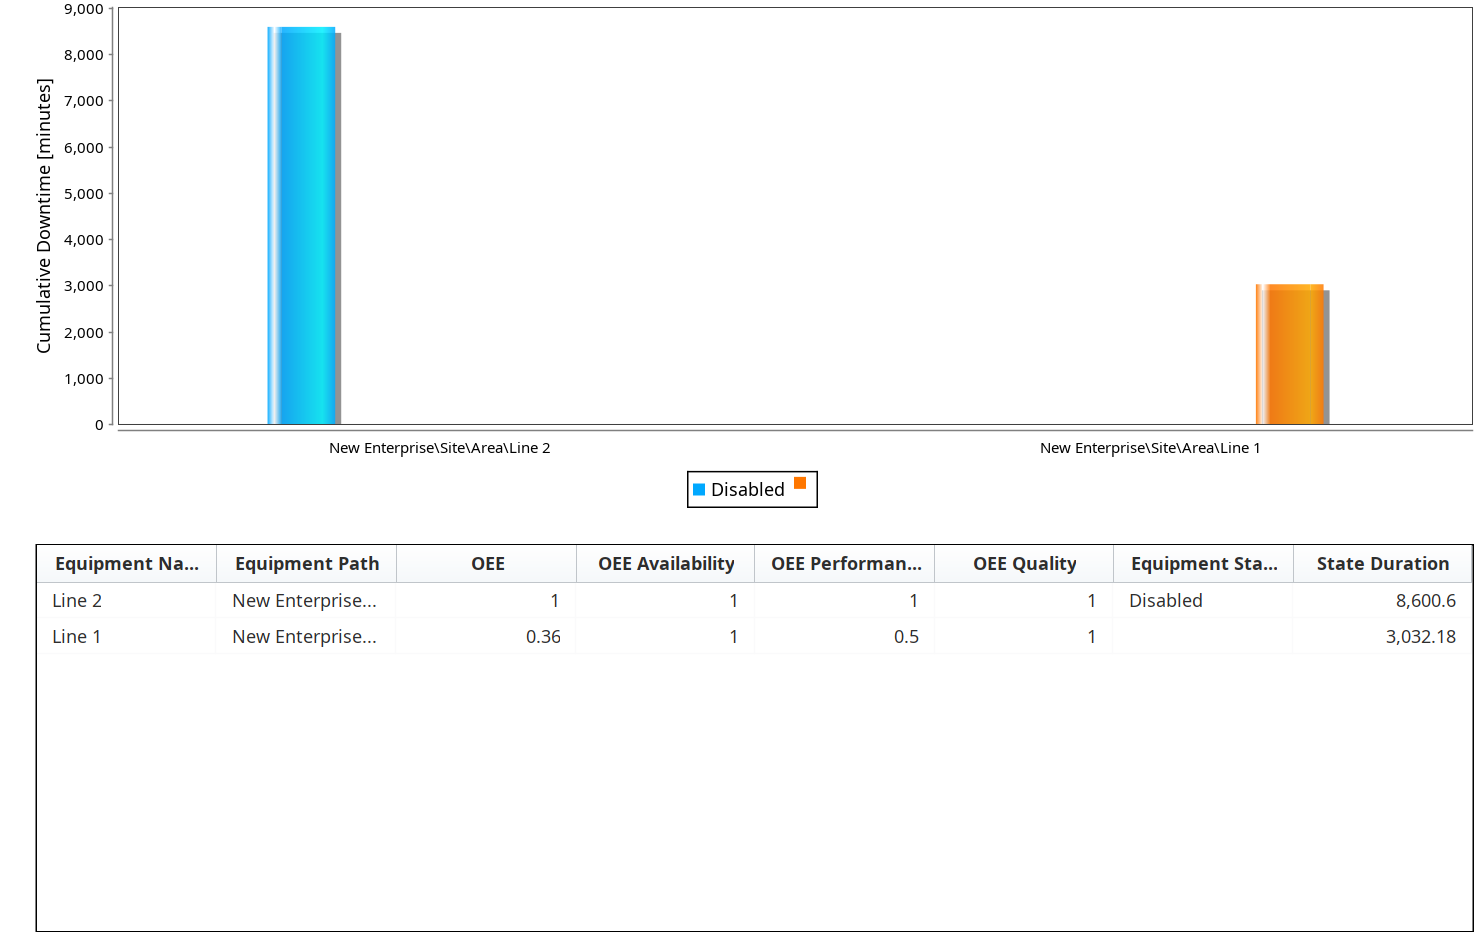
Close and re-open the 04_Reporting screen, to force the data to refresh (this is only required in Designer. When navigating in a live factory HMI scenario, switching screens would trigger a data refresh). Observe that you now have data for both of your Lines showing.
Refresh Button
Just for this tutorial, instead of closing and re-opening the 04_Reporting window, you can refresh the MES Analysis Controller on demand with a Button containing the following script line (which will update the chart and table via its afterUpdate script):
Codeevent.source.parent.getComponent('mac_Table').refresh()Now, you can quickly change your Live Analysis settings and view the new results with the push of a button.
- Right-click on the Production Bar Chart to see that there are several options available for reporting:
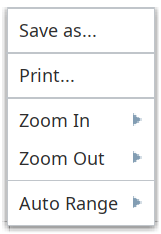
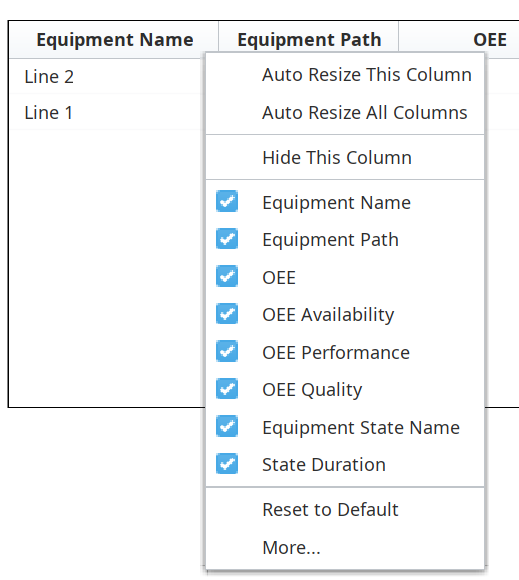
- Right-click on the header row of the Analysis Table to see that there are several options available for reporting: