Set Stored Sample Analysis Config
- In preview mode, select a Sample Definition name from the Stored SPC Selector.
- Note that the SPC Selector component pre-populates with settings per the stored settings. This is the case so long as both components are in the same container.
- Manipulate the SPC Selector settings per your desired analysis. Be aware of the SPC Chart type and the SPC Selector's data format settings must match for proper display.
Analyze Samples on Chart
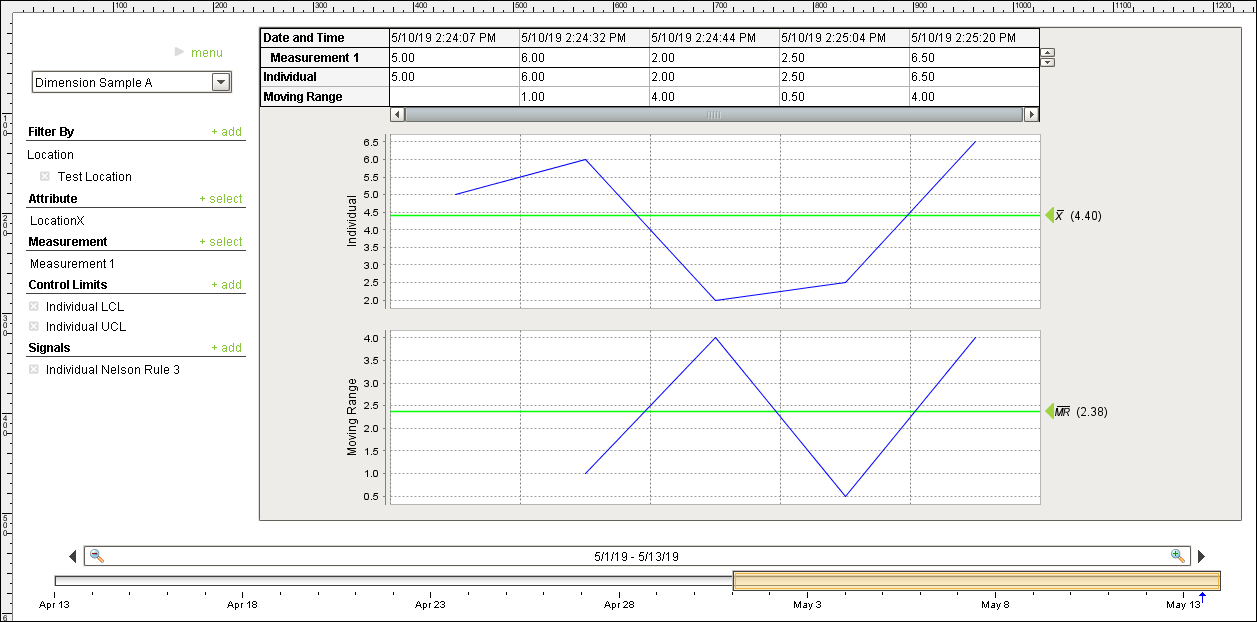
View and explore your samples using the various display options provided by the combination of an SPC Selector and a chart.
- Select various Filter By and Attribute criteria and date ranges, for your chart. Explore the differences in the way data is displayed based on your selections.
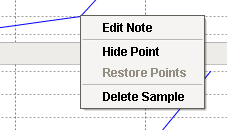
- Right-click on individual samples to see that you can delete, hide, and/or add comments to them.
- Add more samples in the 02_Production Control screen's manual sample collection interface, then view the updates on the Individual and Range Chart used in this tutorial.

|
If you're not seeing data appearing on the Individual and Range Chart, look at the SPC Data Format field of the SPC Selector and make sure it's set to Individual: |

Data display in real time is critical for SPC. Combining that data with context (comments, fault reasons, etc.) empowers decision-making in manufacturing. Consider use cases in your environment that could benefit from this visibility.