Sepasoft MES Module Suite
Viewing Sample Data in Control Charts
The impromptu control chart screen in the demo project allows you to view any sample definition. You can view the samples in different control charts and specify which attributes, signals, control limits, and filters you want to apply.
Analyze SPC Data with Customizable Charts
All the data in the world is of no use without good analysis tools, so we built the Sepasoft SPC Module with a full range of powerful and flexible SPC Control Charts. Based on security roles, control limit values can be calculated and set interactively on the Control Charts. The Additional Factors feature gives you the flexibility to associate and visualize other production information along with SPC data and with customizable appearance settings for charts, tables, control limits and signals, you have the power to see the information you need in the way you want.
The control charts can be separated into three groups: value charts, attribute charts, and analysis charts. On all charts, it is possible to add assignable causes and notes to explain a data point. A sample note can be entered on the Lab or Test Stations page when the sample is first entered. This can be done by selecting a sample, then clicking Add Note. An attribute note is added directly from an SPC chart by right-clicking on a data point and selecting Set Note from the drop-down list. In addition to attribute notes, an assignable cause can also be added in this way. Assignable causes can also be saved for future use. Out-of-Control Signals and Control Limits can also be added to the graphs.
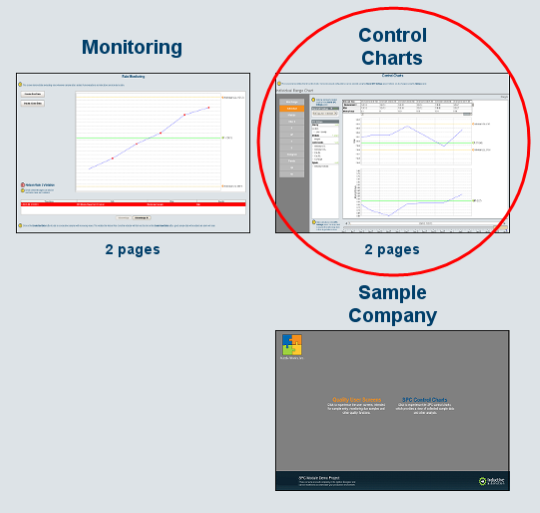
Now that we have collected some samples, we can start viewing them in control charts. Again there is a built-in screen in the quality demo project to view control charts.
Open up the runtime for the quality demo project. Click on the Control Charts image.
Here you can view any sample definition in any control chart (assuming the data works for that control chart). By default each sample definition automatically adds a Stored SPC Setting so you can easily view the control chart.
Stored SPC Settings dropdown
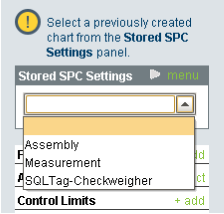
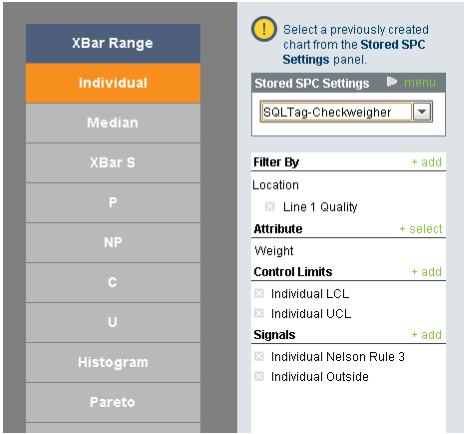
You can certainly create new Stored SPC Settings. Let's use the SQLTag-Checkweigher stored SPC setting. Once you select the setting make sure the Filter By is set to Line 1 Quality. The attribute should be set to Weight. If there was more than one attribute you can select which one you want to view. You can optionally select the limits and signals.
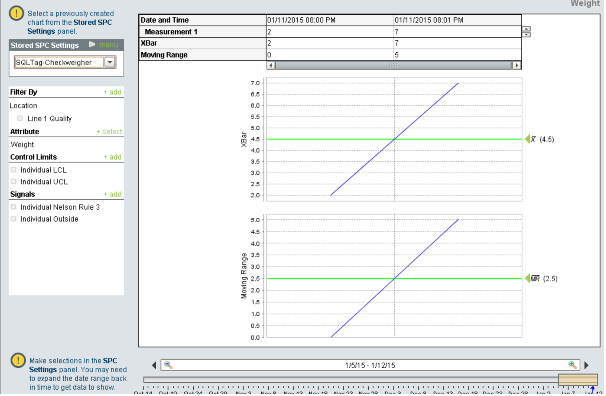
Lastly, select one of the control charts. Let's select the Individual chart for the checkweigher.
You may or may not have data. If you don't have any data go back into the designer and change the Weight tag 5 times for a sample to be entered in. Once you have done that come back to the control chart and change the start and end dates slightly to see the new data.
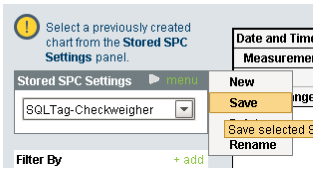
Save your Stored SPC Setting by clicking on menu and then save.
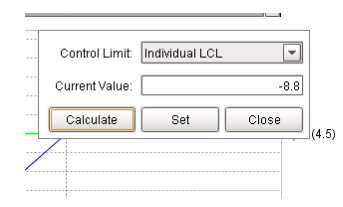
You can right click on the white space to the right of the control chart to set the LCL and UCL limits since they are selected. Select the limit and either set the value yourself or press calculate to let Ignition set it for you.
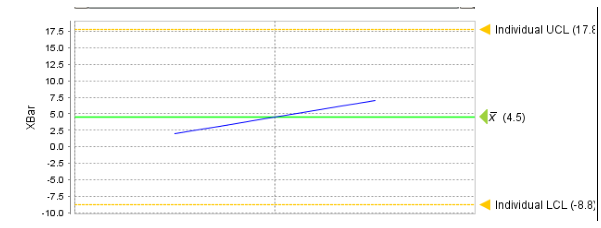
Now your chart will have limits.
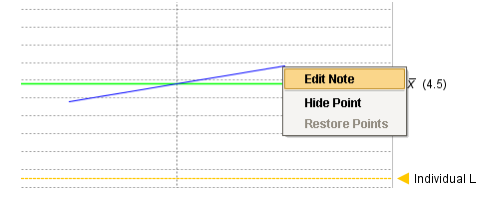
You can also right click on individual points to add notes.
You can do the same thing for each sample definition. Just make sure the appropriate settings are in place, samples are collected, and the correct control chart is selected.
Chart Updates
Add notes to samples as they are taken, and add assignable causes to samples whenever you need to and charts are automatically updated with every new sample, so you can always be sure you see the most accurate data, when you need it.
Sepasoft MES Module Suite