Sepasoft MES Module Suite
Displaying SPC Data in Control Charts
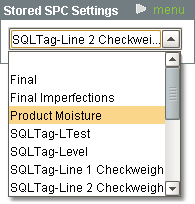
When a sample definition is created or a tag-collector is added to the Quality tab in the Production model designer, it will appear as an option in the Stored SPC Settings selection box as shown.
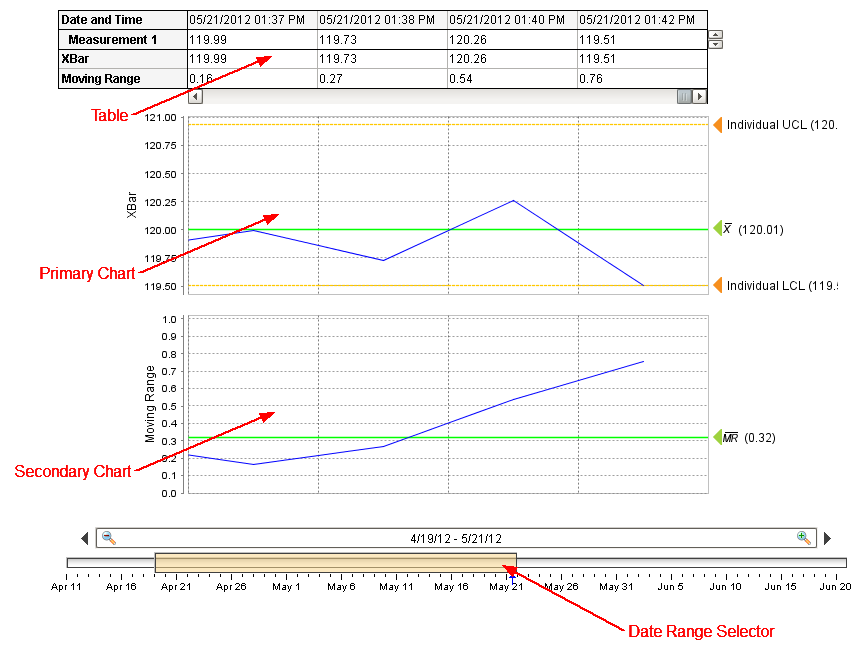
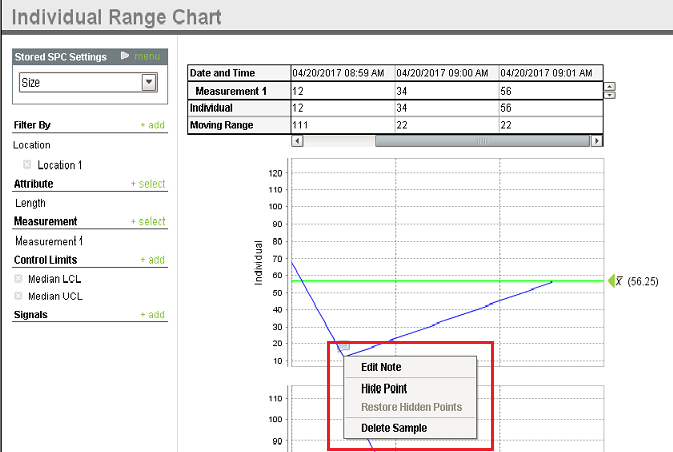
After selecting one of the Stored SPC Settings, the control chart as defined in the Default Control Chart for the sample will be shown. The image to the side labels the major parts of a control chart. The Date Range Selector is used to select the date range of samples to view. It defaults to the current period of time, but can be used to select samples from the past. The table shows collected data and the calculated values. The calculated values that are included depends on the kind of control chart being displayed. When the scroll bar at the bottom of the table is moved to the left, the table, primary chart and secondary chart will all scroll in unison to previous samples within the selected date range.

|
For the attribute type of control charts the secondary table will not appear. |
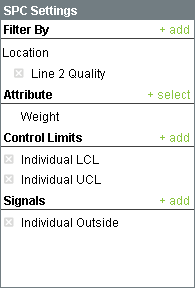
Changing which attribute is currently being shown in the control chart is done using the SPC settings panel. To change the attribute, click on the - select to the right of the Attribute label. This will show all of the attributes defined in the sample definition.
Control limits and signals can be selected or hidden using the same method as the attribute with the exception that more than one control limit or signal can be selected.
SPC Settings
The filter by section allows for limiting the samples that will be shown and included in the calculated values. At a minimum, at least one location must be specified. This is because data collected from one location could be completely unrelated or in a different range than another location. If this is not the case, then multiple locations can be added to the filter.
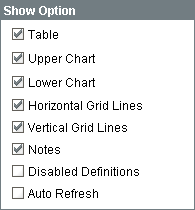
Show Option
The show options allow for the appearance of the control chart to be changed. By removing the Table option, the table will not appear leaving only the charts and allowing more samples to be viewed at once.
Control Chart Menu Items
Right clicking the control chart will give the pop up menu items like Delete Sample, Edit Note, Hide Point and Restore Hidden Points as shown.
Localizable Menu Items
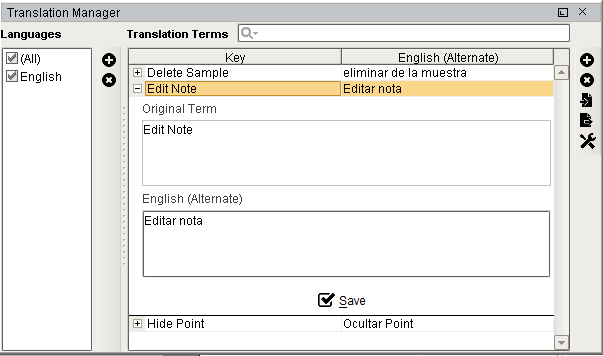
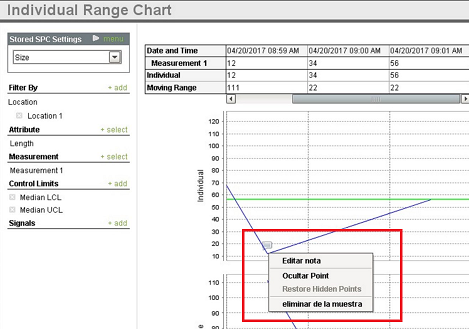
SPC chart popup panel menu strings are localizable. The alternate strings can be added through the Ignition translation manager (not the component translation manager). Reopen the control chart page and right click on a point to manifest the changes.
Sepasoft MES Module Suite