Sepasoft MES Module Suite

Description
The Enclosing Chart Block allows users to nest ('enclose') and execute other charts within the current chart. Mapping allows Chart Parameter values (including B2MML and complex) to be passed to and from the enclosed chart.
Connections
Two connections are required:
Input — (input) Receives execution control from the previous Block in the sequence and passes it to the Start Block of the enclosed chart (one of your other charts, which is selected in the Enclosed Chart property field). Unlimited input connections are allowed (spread across up to three available edges).
Output — (output) Execution control passes back from the End Block in the enclosed chart and out to the Block connected to the Output connection.
Properties
The optional Name and Description fields are included on most Blocks for clarity and documentation benefit.
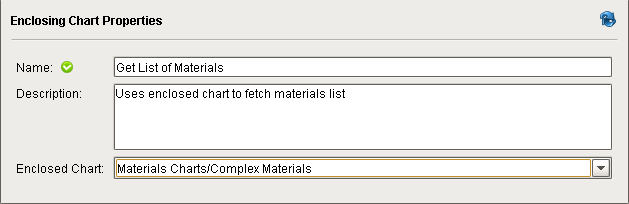
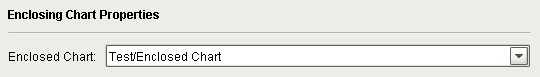
One of the other available charts in the project is selected to be the 'enclosed' chart.
Mapping Parameters
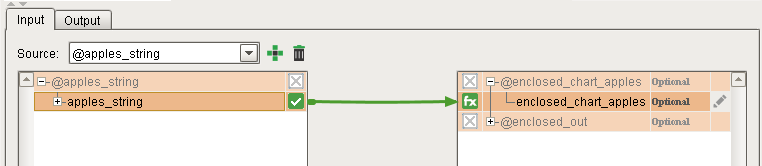
The Mapping pane allows Chart Parameter values (including B2MML and complex) to be passed to and from the enclosed chart. The schemas of all defined Chart Parameters for both the chart containing the Enclosing Chart Block and the enclosed chart will become available for mapping.
Mapping Mismatched Data Types

|
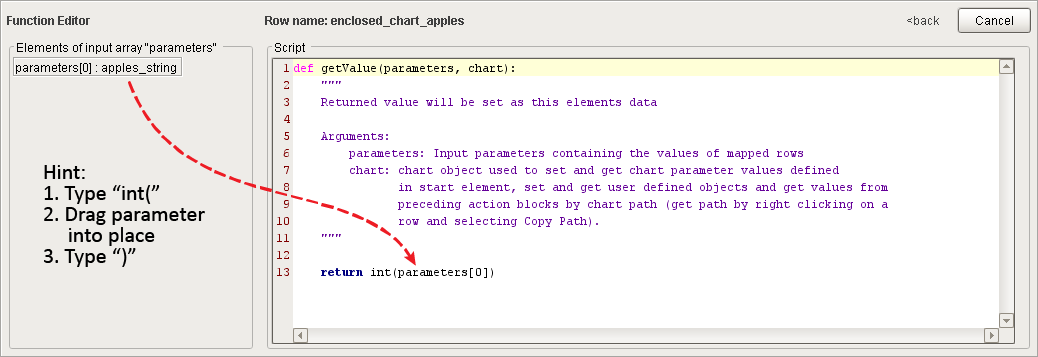
The mapper will allow you to map together parameters with mismatched data types, but you must do the appropriate type conversion in a script function at the receiving parameter. Example: For mapping the string parameter apples_string to the integer parameter enclosed_chart_apples, a one-line script function (
|

Passing Chart Parameter to the Enclosed Chart
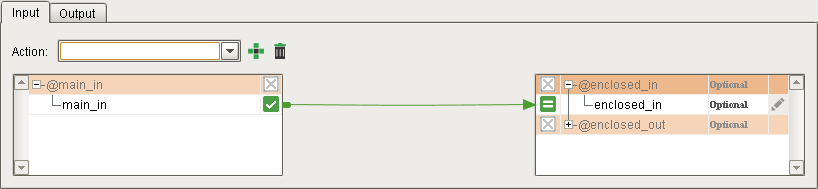
In this example, the Chart Parameter main_in will be passed to the enclosed chart's enclosed_in Chart Parameter (data types must match):

Passing Chart Parameter to the 'Parent' Chart
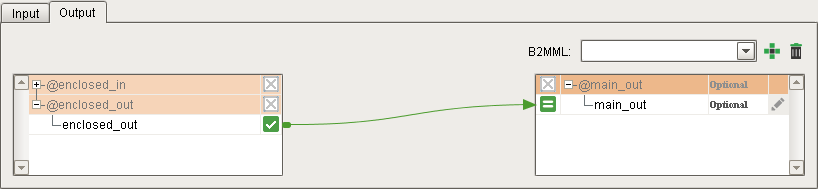
In this example, the enclosed chart's enclosed_out Chart Parameter will be passed to the 'parent' chart's main_out Chart Parameter (data types must match):

Schema Refreshing and Changes
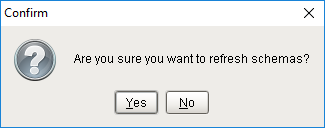
Clicking the Refresh (  ) button will cause a re-fetch of both the input and output schemas. If both schemas still match what is currently selected for each in the Block, then a "Confirm" dialog box will appear.
- Clicking Yes will cause the Block to fetch fresh data.
- Clicking No will abort the refresh.
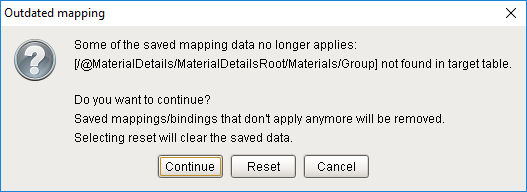
If either schema has been edited, an "Outdated Mapping" dialog box will immediately appear (without the need to press Refresh), with two choices on how to handle the schema mismatch, plus Cancel.
- Clicking Continue will apply all the mappings that are still valid and clean up the outdated mappings.
- Clicking Reset will clear all the saved data and mapping connections and then fetch a fresh copy of both schemas.
- Clicking Cancel will abort the refresh, allowing the user to manually fix the schema without losing saved data.
Usage
Connecting the Enclosing Chart Block
- Drag an Enclosing Chart Block onto the Design Grid (position to be the next block in the chart sequence).
- Click on the previous Block in the sequence and draw a Connector to the Enclosing Chart Block (any available edge). This becomes the Input connection. Repeat for any additional input Blocks, if applicable (unlimited connections are allowed on up to three edges).
- Click on the Enclosing Chart Block and draw a Connector (from any available edge) to the next Block in the sequence. This becomes the Output connection.
Selecting an Enclosed Chart
- Select one of your other charts from the Enclosed Chart drop-down list (must already exist in order to appear in the list).
Mapping Chart Parameters
- In the Input tab, drag a connector arrow to connect a Chart Parameter in the 'parent' chart to a Chart Parameter in the enclosed chart (data types must match). Repeat for any other parameters to be passed.
- In the Output tab, drag a connector arrow to connect a Chart Parameter in the enclosed chart to a Chart Parameter in the 'parent' chart (data types must match). Repeat for any other parameters to be passed.
Example
Enclosing Chart
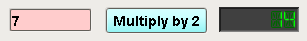
This example chart contains an Enclosing Chart block with an enclosed chart. As shown below, a single data value is passed in from an Ignition Button script, passed into the enclosed chart, doubled, then passed back out to the main chart and back to the button script, demonstrating how parameters values can be passed to/from a chart and to/from an enclosed chart.
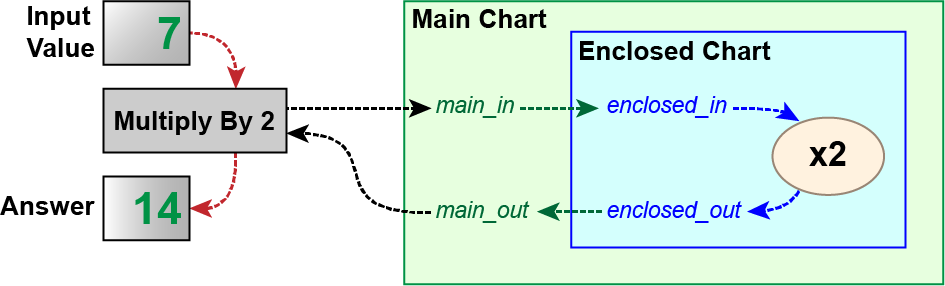
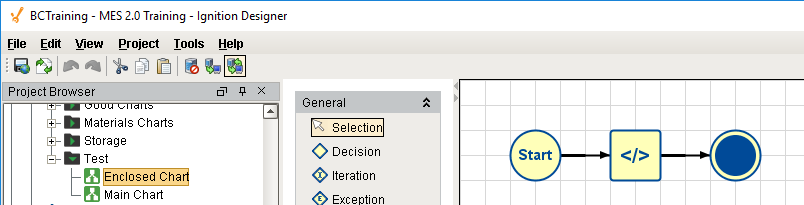
Chart Hierarchy
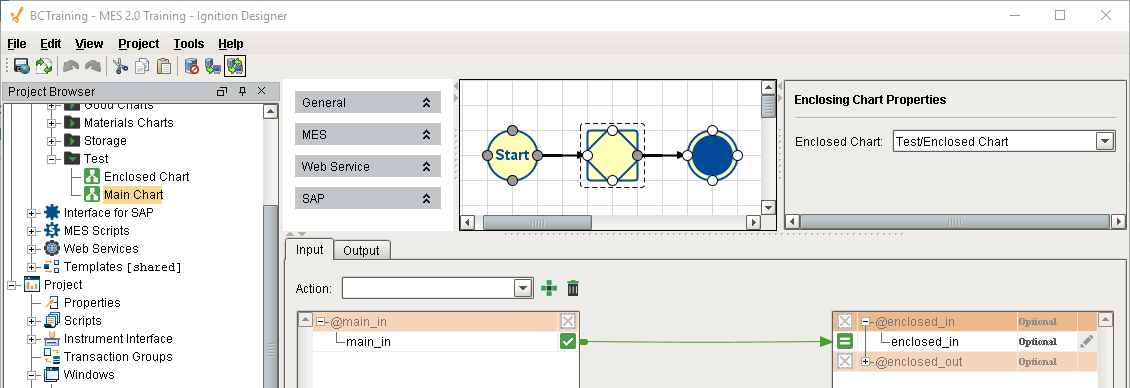
The chart, Main Chart, contains an Enclosing Chart Block, which 'encloses' the chart Enclosed Chart:
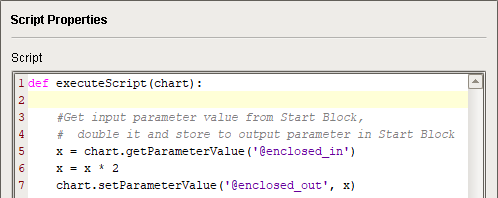
The enclosed chart, Enclosed Chart, contains a Script Block, which reads the value of the Chart Parameter enclosed_in, multiplies it by 2, then writes the result to enclosed_out.
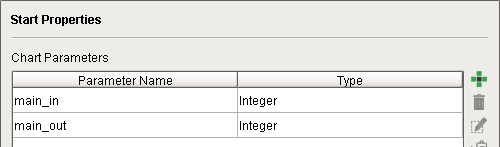
Start Block - Main Chart
The Start Block in Main Chart has two Chart Parameters defined (type Integer):
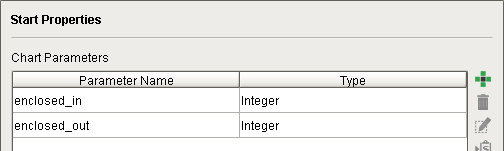
Start Block - Enclosed Chart
The Start Block in Enclosed Chart also has two Chart Parameters defined (type Integer):
Mapping
The Input tab maps what parameters from the 'parent' chart will get passed down into the selected enclosed chart. In this example, the Chart Parameter main_in in Main Chart is mapped to the Chart Parameter enclosed_in in Enclosed Chart. When execution control is about to pass 'into' the Enclosing Chart Block, the current value of main_in will first get passed into enclosed_in in Enclosed Chart:
The Output tab maps what parameters from the enclosed chart will get passed back up to the 'parent' chart. In this example, the Chart Parameter enclosed_out in Enclosed Chart is mapped to the Chart Parameter main_out in Main Chart. When execution control is about to pass back up to the chart Main Chart, the current value of enclosed_out will first get passed into main_out in Main Chart:
Button Script
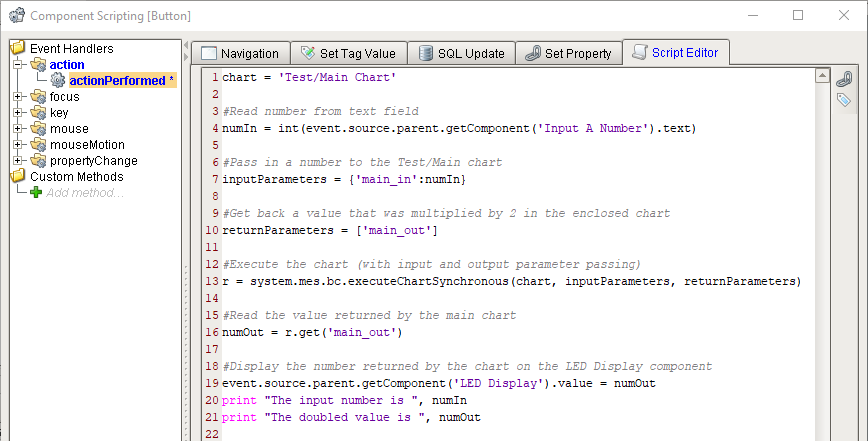
A simple script is written to the actionPerformed event handler of the 'Multiply by 2' button, which reads a user-input value from the Text Field component and passes it into Main Chart , waits for the Python dictionary, r, to be returned, retrieves the value for main_out from it and finally writes it to the LED Display component.
Sepasoft MES Module Suite