Sepasoft MES Module Suite
MES Metric Tags
MES metric tags provide real-time insights into the operational status of the MES gateway. These tags tracks key performance indicators such as CPU usage, database latency, and object cache efficiency, these metrics enable proactive maintenance and troubleshooting.
- Critical Implementation Note: Path Separators
- Core System & Performance Metrics
- System & Performance Metrics
- MES Caching & Object Management Metrics
- Cache & Object Metrics
- MES Module-Specific Metrics
- OEE and Operations Metrics
- SPC Metrics
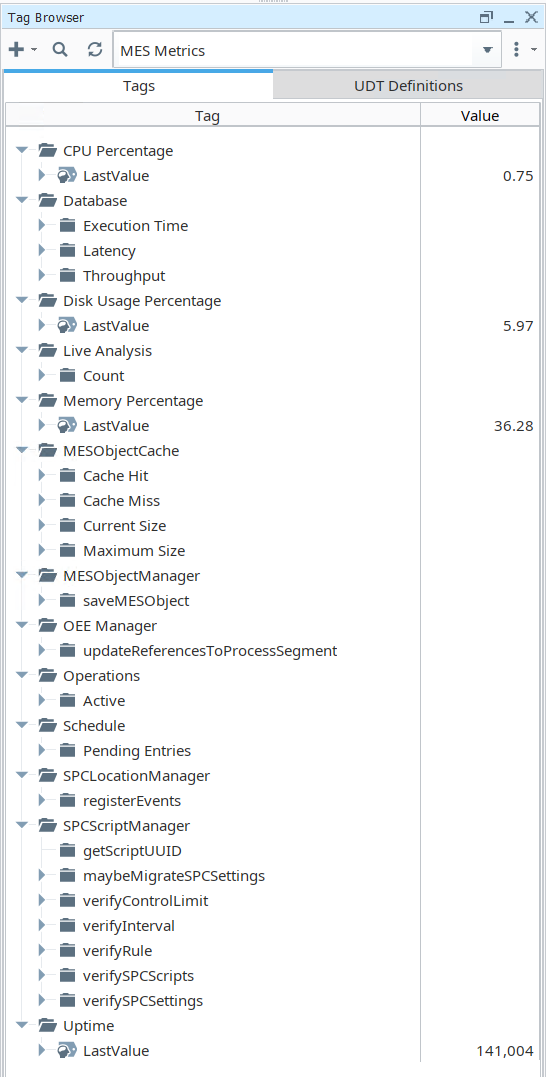
MES Metric Tags display in the Ignition Tag Browser.
Critical Implementation Note: Path Separators
Proper syntax is crucial for ensuring that MES metric tags are correctly recognized and utilized by all system components.
A known discrepancy exists between how different parts of the system interpret path separators. While the core tag provider component correctly processes paths using either a forward slash (/) or a backslash (\), the system monitor component exclusively accepts the backslash (\) as a valid separator for organizing metric groups.
To ensure system-wide compatibility and prevent monitoring failures, a consistent approach must be adopted.

|
Recommendation: To ensure system-wide compatibility, exclusively use the backslash (\) as the path separator for both metric tag paths and equipment paths. Use of the forward slash (/) is not supported by all components and will lead to monitoring failures. |
Core System & Performance Metrics
These metrics provide a high-level overview of the gateway's fundamental resource utilization and responsiveness. They act as the first line of defense in performance monitoring, offering immediate visibility into the core health of the system, from processing power and memory consumption to database connectivity and data throughput. For instance, consistently high CPU Percentage combined with increased Latency could indicate an overloaded gateway, prompting an investigation into running scripts or high client counts.
System & Performance Metrics
Metric Tag | Description |
CPU Percentage | |
Database | The time in milliseconds it takes to get a connection to the Analysis database on that gateway. |
| |
| The time in milliseconds it takes to send an empty message to and back from that gateway. |
| |
Disk Usage Percentage | |
Memory Percentage | |
Uptime | |
| |
Live Analysis | |
|
MES Caching & Object Management Metrics
The MES Object Cache stores MES objects in memory to accelerate data retrieval and reduce database load. Monitoring the metrics associated with this cache is vital for evaluating memory efficiency, diagnosing slow data access, and identifying potential bottlenecks related to in-memory storage. A high Cache Miss rate relative to Cache Hits may suggest that the cache is undersized for the current workload, forcing frequent, slow queries to the database.
Cache & Object Metrics
Metric Tag | Description |
Object Cache | How many objects are currently stored in memory in the MES Object Cache in the gateway. |
MESObjectCache | |
| |
| |
| |
| |
MESObjectManager | |
|
MES Module-Specific Metrics
The following sections detail metrics tied to specific MES modules, allowing for targeted performance analysis of distinct operational functions.
OEE and Operations Metrics
Metric Tag | Description |
OEE Manager | |
| |
Operations | |
| |
Schedule | |
|
SPC Metrics
Metric Tag | Description |
SPCLocationManager | |
| |
SPCScriptManager | |
| |
| |
| |
| |
| |
| |
|
Sepasoft MES Module Suite