Sepasoft MES Module Suite
Properties Common to SPC Charts with Measurable Values
These properties are available in the Ignition Properties Palette for SPC Charts that have values that are measurable with datatypes such as floats and integers.
Name Scripting Reference | Data Type | Description | ||||||||||
|---|---|---|---|---|---|---|---|---|---|---|---|---|
| columnWidth | Integer - The width of the table columns. | |||||||||||
| dateFormat | The date formatting pattern used to display the date MM/dd/yyyy dd-M-yyyy hh:mm:ss dd MMMM yyyy | |||||||||||
| rowHeight | The height of the table rows. | |||||||||||
| scrollX | The scroll bar x position. | |||||||||||
| showTable | Boolean - Toggle to show or hide the sample data table. When showTable is set to True: Table Chart Scroll LockingThe table chart scroll locking feature provides a user-controlled mechanism to either automatically navigate to the most recent data upon its arrival or maintain the current scroll position. The scroll lock feature operates in two distinct modes, each with specific UI indicators and behavioral responses to new data.
| |||||||||||
| editControlLimitImagePath | Boolean - Image icon to show to edit control limits. | |||||||||||
| enableControlLimitEditing | Toggle show/hide When enabled, an edit button is displayed. Once a control-limit type is selected and Calculate is checked, a limit value is calculated and displayed. If the value box is populated and date is selected, you can choose to set the limit value. A message displays:
| |||||||||||
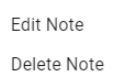
| enableNoteEditing | Boolean - If true, you can add and edit notes on the chart. |
| ||||||||||
| enableNoteDeletion | Boolean -If true, you can delete notes on the chart. | |||||||||||
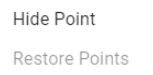
| enablePointDeletion | Boolean -If true, you can hide/restore data points on the chart. |
| ||||||||||
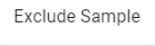
| enableSampleDeletion | Boolean -If true, you can exclude samples on the chart. |
| ||||||||||
| limitDialogOffsetX | Integer - The horizontal offset to display the control limit dialog box. Works in conjunction with enableControlLimitEditing | |||||||||||
| limitDialogOffsetY | Integer -The vertical offset to display the control limit dialog box. Works in conjunction with enableControlLimitEditing | |||||||||||
| markerImagePath | String - The relative path of an image to display for markers. | |||||||||||
| noteImagePath | String -The relative path of an image to display for notes when showNotes is enabled. | |||||||||||
| primaryChartAxisTitle | String -Title to show for the primary axis. The color attribution is based on the sequence in which the additional factors are added to the SELECT statement in the FilterBy clause. | |||||||||||
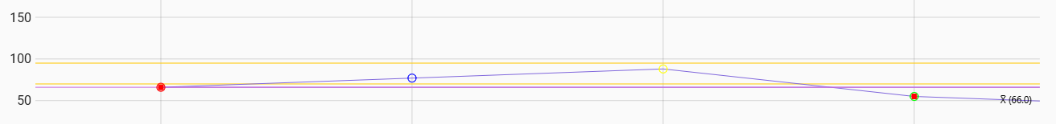
| showAdditionalFactorColors | Boolean - Defaults to True. In 3.81.11 SP1 and later The color attribution of the points on a chart is based on the sequence in which you add additional factors to the FilterBy clause of the Select statement. When a point on a chart is outside a Control Limit the circled is filled-in as a solid circle. When inside the limits, the circle is an outline.
| |||||||||||
| showAttributeNameAsTitle | Boolean - Defaults to False. In 3.81.10 SP8 and later. When true the first attribute on the chart is used as the chart title. If there is more than one attribute displayed on the chart, then the first attribute name is used. If the attribute displayed on the chart is changed, then the title changes to match the attribute. Supersede the Chart Title. | |||||||||||
| showNotes | Boolean -If true, notes display on the chart. | |||||||||||
| showPrimaryAverage | Boolean -Set to true to display the average line on the primary chart. | |||||||||||
| yAxisMax | String and Integer -Plots all the values up to and including the maximum value. | |||||||||||
| yAxisMin | String and Integer -Plots all the values down to and including the minimum value. | |||||||||||
| axisStyle | ||||||||||||
| rightAxisWidth | Integer | Width of the right chart axis | ||||||||||
| chartStyle | ||||||||||||
| horzGridLineColor | Boolean | If true, show horizontal grid lines on charts. | ||||||||||
| primaryChartBackground | Color, picker available | The background color of the primary chart. | ||||||||||
| showHorizontalGridLines | Boolean | f true, show horizontal grid lines on charts. | ||||||||||
| vertGridLineColor | Color, picker available | The color of vertical grid lines. | ||||||||||
| chartDataStyle | ||||||||||||
| calcBackground | Color | Sets the background color. | ||||||||||
| calcFont | Font family | Sets the font family | ||||||||||
| calcForeground | Color, picker available | Sets the foreground color | ||||||||||
| dataBackground | Color | Sets the background color. | ||||||||||
| dataFont | Font family | Sets the font family | ||||||||||
| dataForeground | Font family | Sets the foreground color | ||||||||||
| dateBackground | Color | Sets the background color. | ||||||||||
| dateFont | Font family | Sets the background color. | ||||||||||
| dateForeground | Color, picker available | Sets the foreground color | ||||||||||
| visibleMeasurements | int | The number of measurements to show in the table. | ||||||||||
| chartMarkerStyle | ||||||||||||
| markerLabelFont | Font family | The font family to use for markers. | ||||||||||

Sepasoft MES Module Suite