Sepasoft MES Module Suite
OEE Time Chart
The OEE Time Chart component provides a visual of exactly what is happening on your production line. It can be configured to show modes as well as states, and to also show line schedule information. The time range to show data for is configurable through the start date and end date properties. You will need to provide an equipment path to the line.
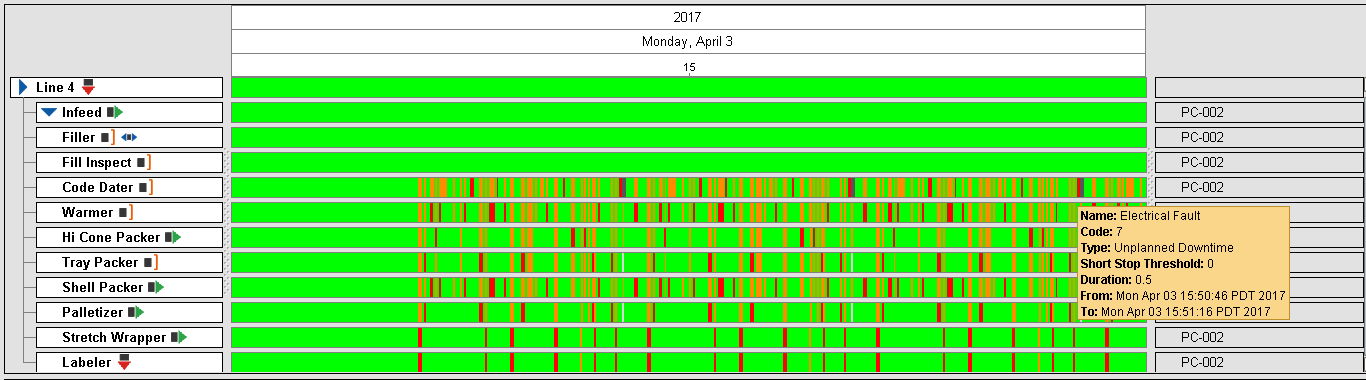
Current equipment status information is displayed on the left hand side and is based on the equipment state type. On the right hand side, extension functions provide you with a method to customize this component by adding any type of equipment data you wish to show.
For more information please refer to the OEE Time Chart - Vision component help in the reference section.
OEE Downtime Table
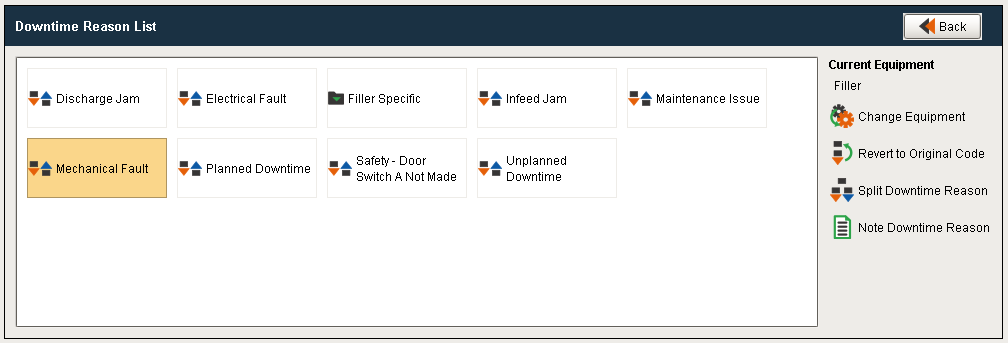
The OEE Downtime Table component displays all events that caused the production line to go down. This component can be used to display line downtime events for the currently running process as well as for production runs in the past. It also provides a method for modifying the cause of a line downtime event and to add notes about the cause.
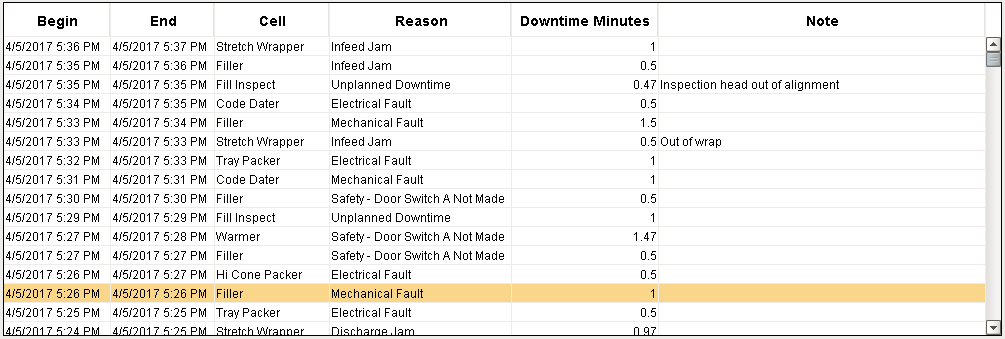
For more information please refer to the OEE Downtime Table component help in the reference section.
Sepasoft MES Module Suite