Sepasoft MES Module Suite
SPC Controller
An invisible component that makes SPC data available for reports and other components. The term invisible component means that this component appears during design time, but is not visible during runtime.
In cases where the SPC Selector offers too many options to the user, this component can be used. It has all of the same functionality as the SPC Selector but without the user interface. This means property bindings or script must be used to make the filter, compare by and data point selections. It also is used for providing data to canned reports and optionally allowing the user to make limited filter options.
To display the SPC results of this component in a control chart, bind the SPC Results property of the control chart to the SPC Results property of this component.
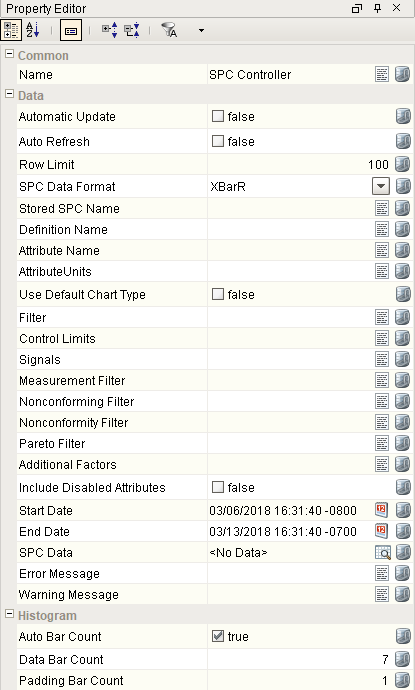
Component Properties
Properties are provided that can be set to affect the operation and look of the component. They can be set through the Property Editor in the Designer or through scripting.
Example
Code |
|
Data
| Name | Scripting | Property Type | Description |
|---|---|---|---|
| Automatic Update | automaticUpdate | boolean | If true, automatically update when property values change. |
| Auto Refresh | autoRefresh | boolean | If true, refresh data when sample or definition information changes. |
| Row Limit | rowLimit | Int4 | The maximum number of samples to return in the results. |
| Stored SPC Name | storedSPCName | String | Optionally, used to set the SPC Controller to the same settings as a Stored SPC. |
| Definition Name | definitionName | String | Name of the sample definition. |
| Definition Version | definitionVersion | Int4 | Version of the sample definition. |
| Attribute Name | attributeName | String | Name of the sample attribute. |
| AttributeUnits | attributeUnits | String | The units label of the current sample attribute. |
| AttributeDefaultChart | attributeDefaultChart | String | The default chart of the current sample attribute. |
| Use Default Chart Type | useDefaultChartType | boolean | If true, uses the default chart type from the attribute definition. |
| Filter | filters | String | Summarizes your filter selections in a string. e.g. "Location=Nuts Unlimited\Folsom\Assembly\Assembly Station 1". Note, do not include '\\' in the equipment path. |
| Control Limits | controlLimits | String | Enter the string value for the chart-specific control limits to be displayed on your chart (e.g. "Cp LSL, Cp USL"). Values may be custom, or select one or more pre-existing limits here: Control Limits |
| Signals | signals | String | Summarizes your signal selections in a string. |
| Measurement Filter | measurement | String | Measurement number to filter on. |
| Nonconforming Filter | nonconformingFilter | String | Nonconforming items to filter on. |
| Nonconformity Filter | nonconformityFilter | String | Nonconformity items to filter on. |
| Pareto Filter | paretoFilter | String | Items to include in Pareto chart. |
| Additional Factors | additionalFactors | String | Additional factors to include in the data property. |
| Include Disabled Attributes | includeDisabledAttributes | boolean | If true, sample attributes that are disabled will be included. |
| Start Date | startDate | DateTime | Start Date to filter SPC results. |
| End Date | endDate | DateTime | End Date to filter SPC results. |
| SPC Results | sPCResults | SPCResults | SPC Results including data, measurement count and calculated value information. |
| SPC Data | sPCData | Dataset | The SPC data. |
| Measurement Count | measurementCount | int | Number of measurements in the SPC results. Note that the max number of measurements is 500. |
| Calculated Values | calcValues | SPCCalcValueCollection | Calculated value definitions. |
| Error Message | errorMessage | String | Error message. |
| Warning Message | warningMessage | String | Warning message. |
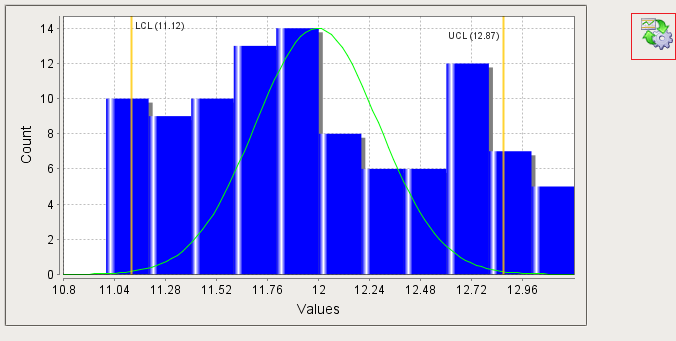
Histogram
| Name | Scripting | Property Type | Description |
|---|---|---|---|
| Auto Bar Count | autoBarCount | boolean | If true, the number of data bars to include in the histogram results will be automatically calculated. |
| Data Bar Count | dataBarCount | Int4 | If Auto Bar Count is false, the number of data bars to include in the histogram results. |
| Padding Bar Count | paddingBarCount | Int4 | The number of bars prior to and following the data bars to include in the histogram results. |
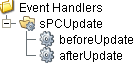
Event Handlers
Event handlers provide the ability to add custom script when a user interacts with a component.
sPCUpdate
beforeUpdate
Is fired just before SPC results are requested from the SPC module.
| Property | Description |
|---|---|
| .source | The component that fired this event. |
afterUpdate
Is fired just after SPC results are requested from the SPC module.
| Property | Description |
|---|---|
| .source | The component that fired this event. |
Extension Functions
This component does not have extension functions associated with it.
Custom Methods
Custom methods allow you to add your own component functions to a component that can be called through scripting. This is a useful and clean method of re-using script that is specific to the component (say you want to update a visual aspect of the component in the same way whether a user clicks on the component or a window property value changes). See Component Custom Methods in the Ignition Help Manual for more information.
Customizers
This component does not have any custom properties.
Component Functions
This component provide the following functions that can be called on it. If this component has been dropped onto the windows root container, the path and an example call would be event.source.parent.getComponent('SPC Controller').update().
update()
- Description
Causes the SPC results to be updated.
- Parameters
None
- Return
Nothing
- Scope
Client
refreshInfo()
- Description
Causes the sample definition information to be refreshed.
- Parameters
None
- Return
Nothing
- Scope
Client
Sepasoft MES Module Suite