Sepasoft MES Module Suite
What is Statistical Process Control (SPC)?
SPC is a specialized quality control technique that leverages statistical methods to monitor and control manufacturing processes. Its primary goal is to ensure efficient process operation, leading to the production of "more specification-conforming products with less waste."
- Functionality: The Sepasoft SPC module enables the collection of samples, analysis of test data, and detection of rule violations.
- Purpose: To proactively identify and address deviations in a process, ensuring consistency and quality.
The Broad Concept of Quality in Manufacturing
Quality is defined broadly as a measure of excellence or a state of being free from defects, deficiencies and significant variations. In manufacturing, achieve excellence by meeting set standards to ensure products meet customer requirements."
- Key Aspects of Quality: Defect Prevention: Quality aims to prevent defects and inconsistencies.
- Customer Satisfaction & Loyalty: Delivering quality products is crucial for customer satisfaction, loyalty, and long-term revenue.
- Cost Reduction: Maintaining quality reduces costs associated with replacing faulty goods.
- Industry Stability: Ensuring product quality is essential for a stable manufacturing industry by distinguishing "defective items from good ones."
Quality Versus SPC: A Hierarchical Relationship
It is crucial to understand that Quality is a much broader concept than SPC. SPC is a tool in the Quality process and serves as a tool within the Quality management process.
- Quality Encompasses More: Addressing quality issues often requires a systematic approach beyond just SPC, involving techniques like brainstorming and fishbone diagrams to pinpoint root causes. Examples include investigating "rust in pipes, changes in chemical formulations, or variations in raw materials" for off-color products.
- SPC's Role in Quality Management: SPC becomes valuable after likely causes of a quality issue are identified. It is then used to monitor specific attributes to identify and address the root cause. For example, if pH level fluctuations cause off-color products, SPC can be employed to track and correct these variations promptly. This demonstrates SPC's role in "proactive approach ensures timely interventions.
Sources of Variation Monitored by SPC
SPC focuses on understanding and controlling variation within a process. Sample data for SPC variation is categorized into three main areas:
- Environment: Examples include temperature, humidity, air-flow.
- Materials: Examples include pH" of raw materials.
- Methods: Examples include manual, tag.
Discussion | SPC Causes of Variation
When a manufacturing process involves complex machines to complete production, a temporary malfunction or a breakdown in an intricate piece of equipment can affect the manufacturing process. Identifying means of improving efficiency of all working parts of production promotes a continual and more efficient operation. Positioning of equipment and the personnel required to operate machines can also affect production.
Environment
The climatic conditions to which the commodity was exposed before receipt; what conditions are likely to occur whilst commodities are held in storage.
Raw materials
The availability of materials and the development of new, hi-technology materials will have an influence on the final design of a product. Quality of the finished product always depend on the quality of raw materials.
Methods
Quality also depends on the methods used to produce it and the chemicals added during production. To maintain high standards of quality, companies are investing in new machines and following new procedures and methods these days.
SPC Samples: The Foundation of Data Collection
Sampling is the process of selecting units from a population of interest so that by studying the sample we can generalize our results back to the population from which they were chosen.
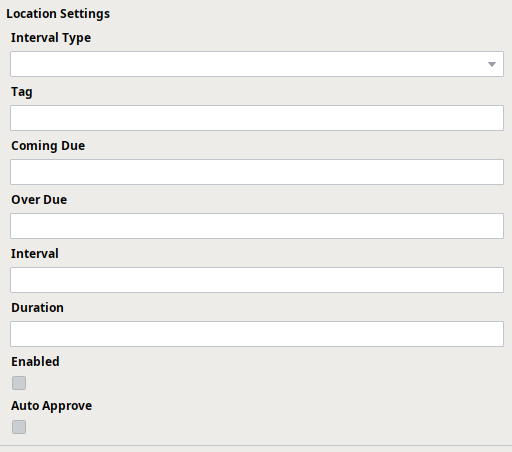
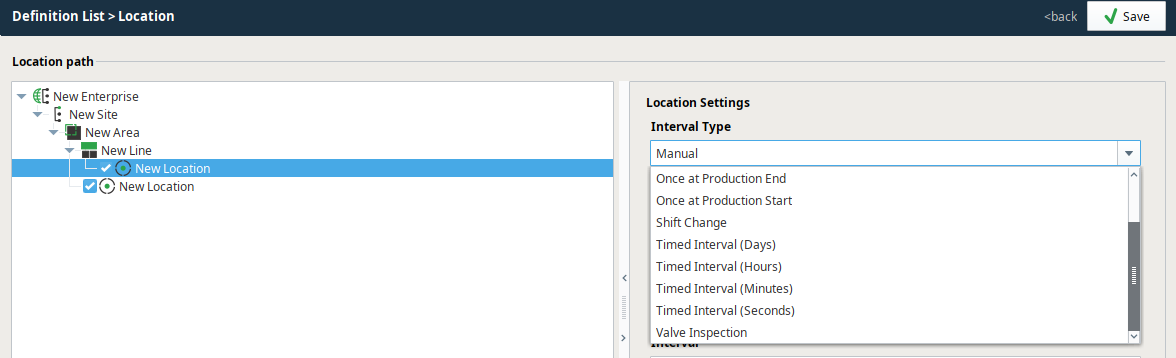
- Key Sampling Definitions and Configurations: Interval Type: Defines when samples are taken. Options include Manual, shift-based or time-based.
- "Time-based interval and Auto Approve" allows automatic sampling.
- "Shift- or time-based Interval Type and Auto Approve set to False" is an example of semi-automatic sampling.
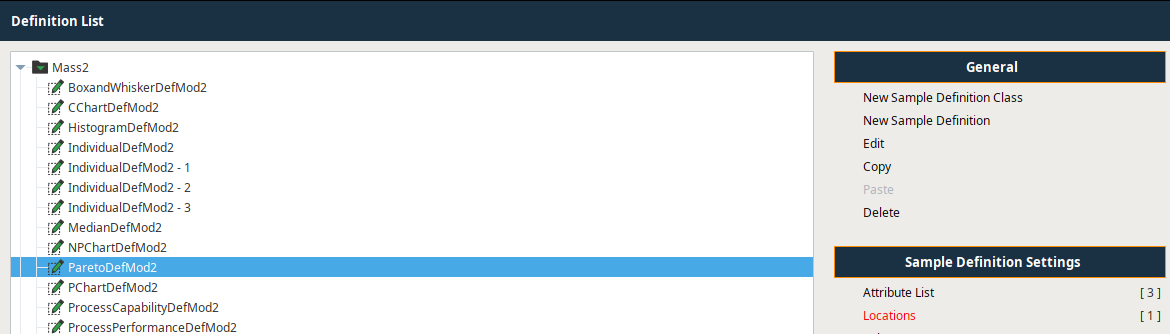
- Configured in Sample Definition Manager > Locations.
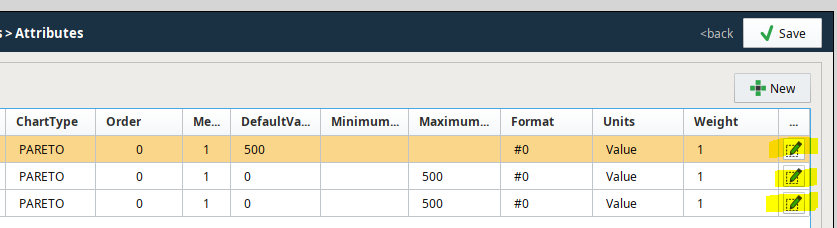
- Measurement Count (Sample Size): Defines how many measurements defines your sample size.
- Configured in Sample Definition Manager > Attribute List.
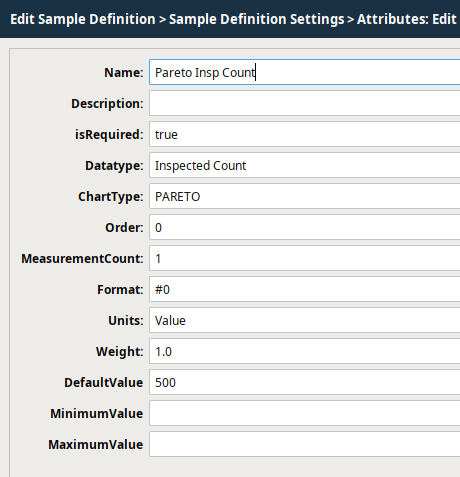
- Attribute List: Defines the characteristics being measured for each sample.
- Datatype: "Integer, Real, Boolean, Inspected Count, Nonconforming Count, Non-conformity Count."
- Chart Type: "value charts, attribute charts, analysis charts."
- Other configurable properties: "Order, Units, Weight, Default Value, Min/max values.
When the SPC module with the core Production module are installed, you access SPC settings in the Sample Definition Manager component:
- Interval Type: when to sample. This is configured in the Sample Definition Manager.
 | |
 | Location Settings
|
Location Settings exist for Locations that have been configured in Equipment Manager installed with the Production module. You select location(s) in the Location Tree to view/edit settings. | |
 | |
Measurement Count is where you set the sample size and defines the number of measurements taken in a Sample.
This is configured in the Sample Definition Manager under, Attribute List > Measurement Count.
 |  |
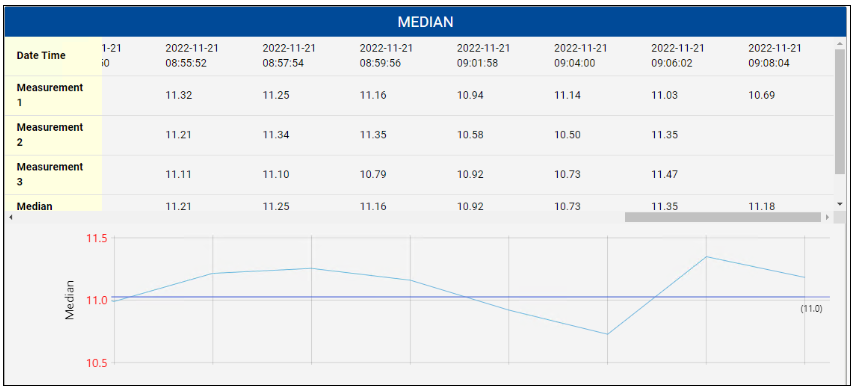 | Example 1 Sample includes 3 measurements Measurement Count
|

SPC Values, Attributes, and Standard Deviation
Attributes are added to Sample Definitions.
SPC Standard Deviation
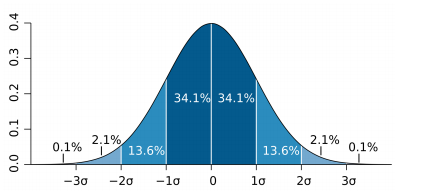
In statistics, the standard deviation (SD, also represented by the Greek letter sigma, σ for the population standard deviation or s for the sample standard deviation) is a measure that is used to quantify the amount of variation or dispersion of a set of data values. In other words it is the amount that we are deviating.
Standard deviation of sample means is calculated with the following equation:

where σx is the standard deviation of individual measurements and n is the sample size. The Upper (UCL) and Lower (LCL) control limits are calculated by the following equations:
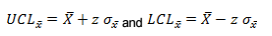
where the z value is the number of standard deviations (sigmas) from the mean to put the control limits.
Sepasoft MES Module Suite