Displaying SPC Charts Dynamically with SPC Analysis Selector
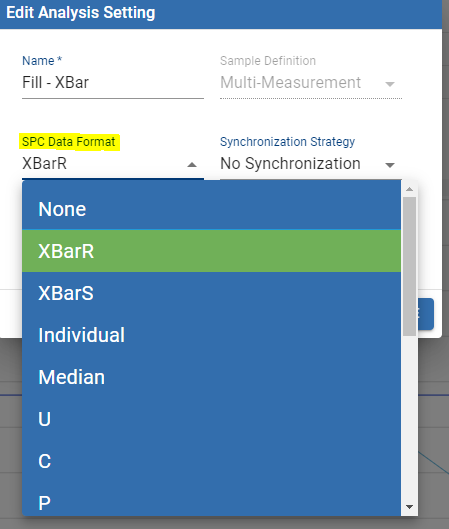
The SPC Analysis Selector is used to create Stored SPC Analysis Settings. These stored settings can be used in SPC Charts, SPC Controller or SPC Analysis Script functions.
Use this setup to:
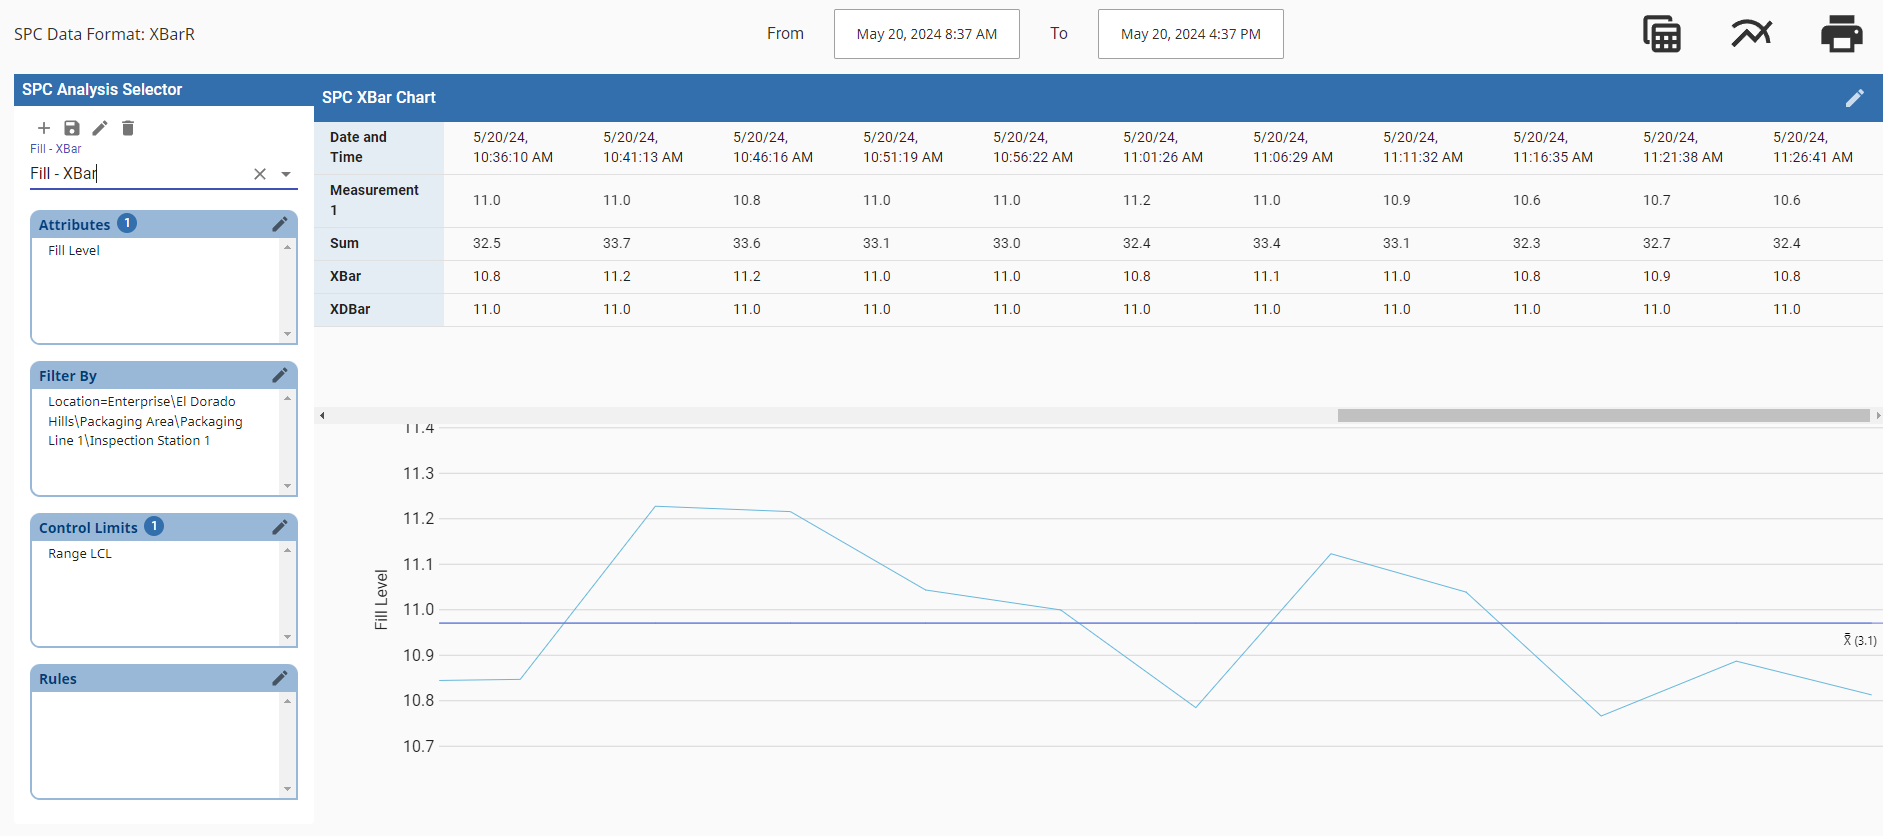
- Create, test, and view output data in an interactive reporting environment.
- Output SPC calculations as raw data to a table or pushed to the appropriate chart.
- View multiple SPC chart types with a compatible format.
Resource:
- Perspective project resource that includes the SPC Analysis Selector component, Ignition Table for raw output, and SPC charts for visualization.
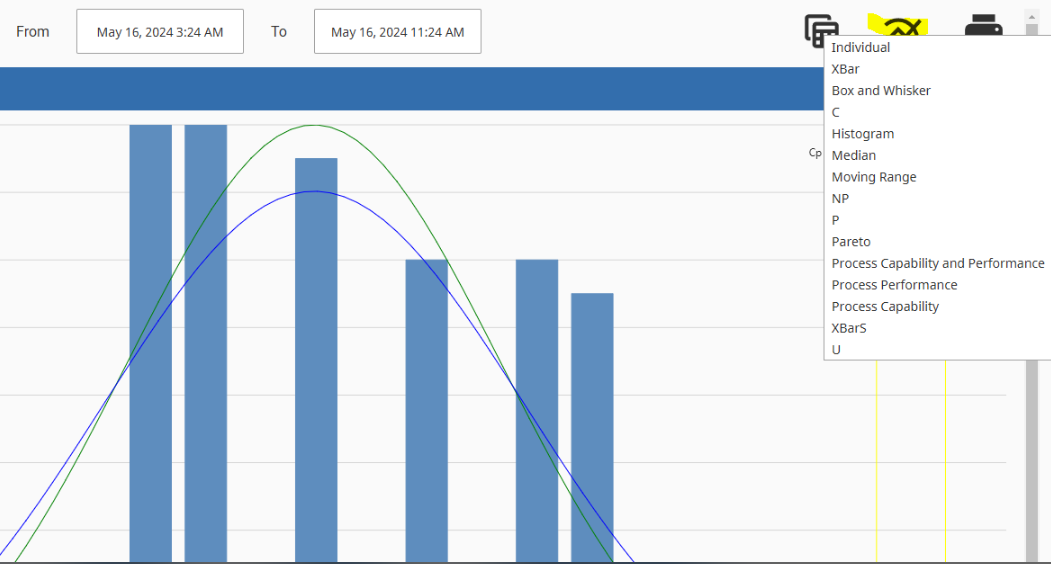
Once an SPC Analysis Setting is created, the appropriate charts are listed under SPC Data Format:
When picking from the configured list of analysis settings, the page displays the chart based on the SPC data format selected.
This behavior can be overwritten by right-clicking the chart icon and selecting a different chart.

|
The data format must be compatible with the chart type. See Measurable vs Non-Measurable Items and Control Charts. |