Creating Business Connector Chart
We will create a Business Connector chart called getOrderIDs to execute the Named Query getProductionOrderIDs that has been supplied in the project files. The chart will map in data from a Perspective view called ProductionOrderById which we will edit to execute the chart and populate a table of data.
Assemble Chart Blocks
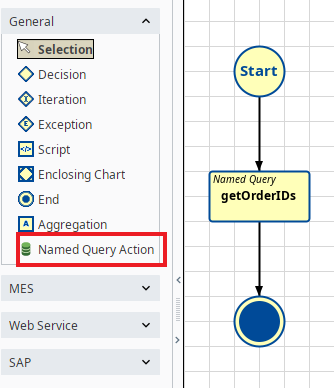
- Drag on a Named Query Action Block and an End Block. Connect them together as shown to the right.
- Rename the Named Query Action Block to getOrderIDs.
Configure Start Block
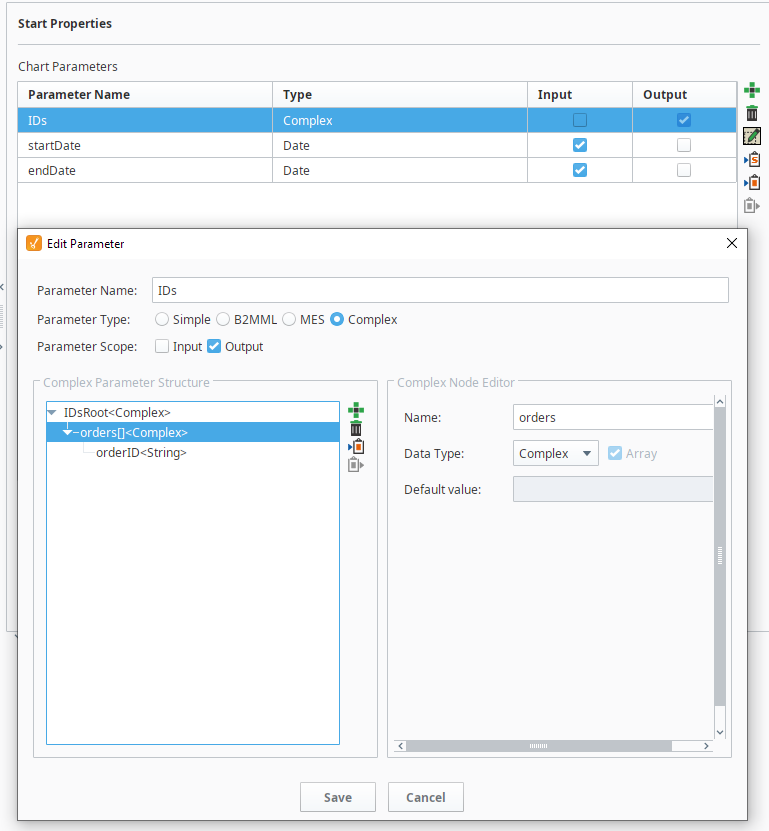
The chart will pass two chart parameters into the the Named Query getOrderIDs. The output of the named query is a list of orders.
- Create the following chart parameters:
- Input param: startDate - data type = Date
- input param: endDate - data type = Date
- output param: IDs - data type = Complex
- Set the Input and Output checkboxes as shown on the right.
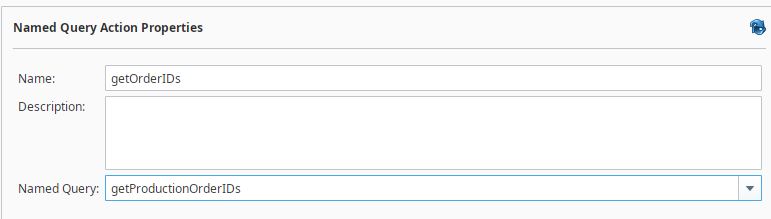
Configure Named Query Action Block
- Set the Named Query Action block to execute the Named query getProductionOrderIDs
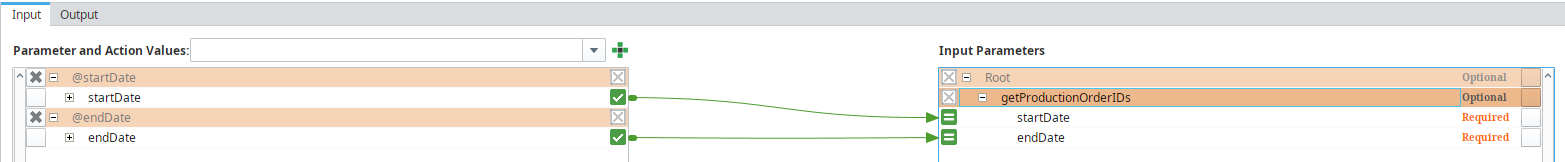
- In the Mapping area, select the Input tab and add the chart parameters @startDate and @endDate
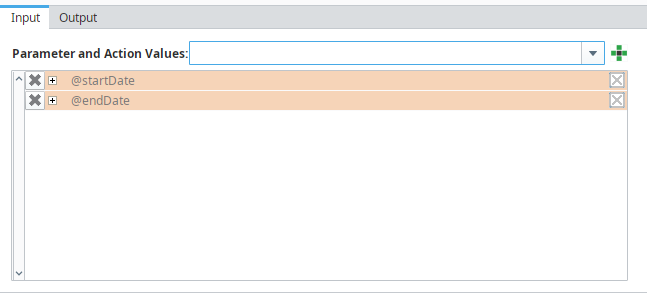
- Expand @startDate and @endDate and map to the named Query stardDate and endDate.
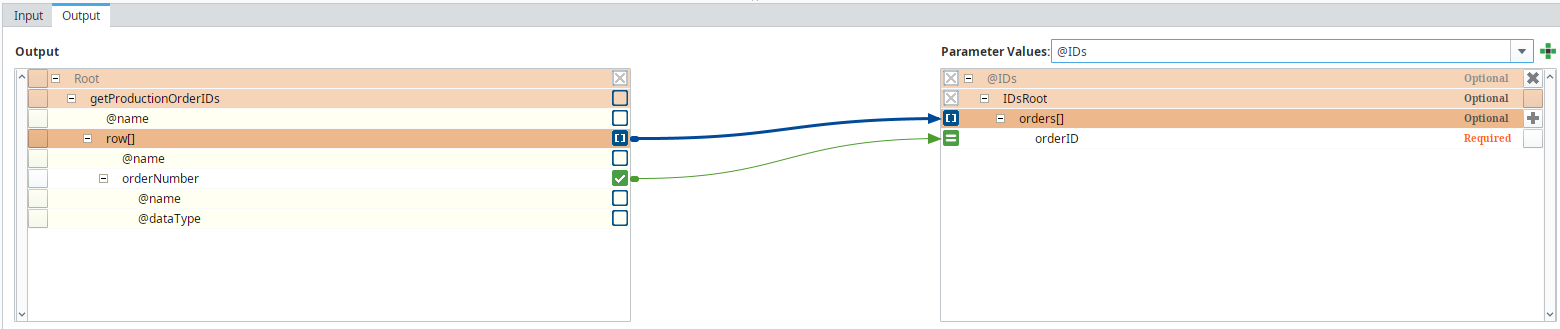
- Select the Output tab and add the @IDs parameter
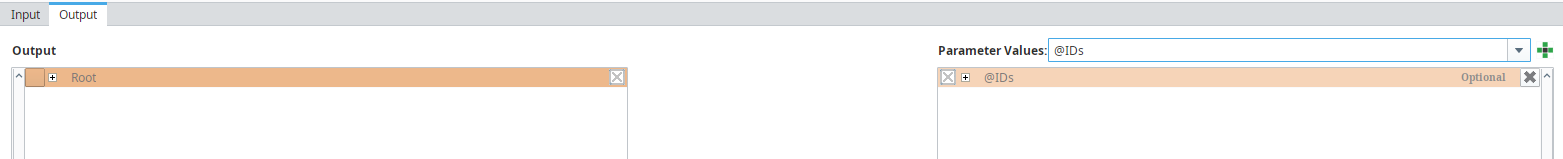
- Map the output as shown below: