Configure weatherREST API
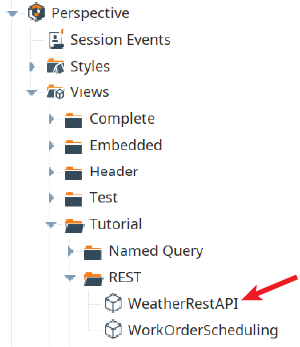
The weatherRestAPI view is located in the Perspective → Views → Tutorial → REST folder. Now configure it to call your new business connector chart, which calls the getWeather consumer and display the results graphically using the Ignition Map component. Portions of the Perspective view have been been pre-built to save time.
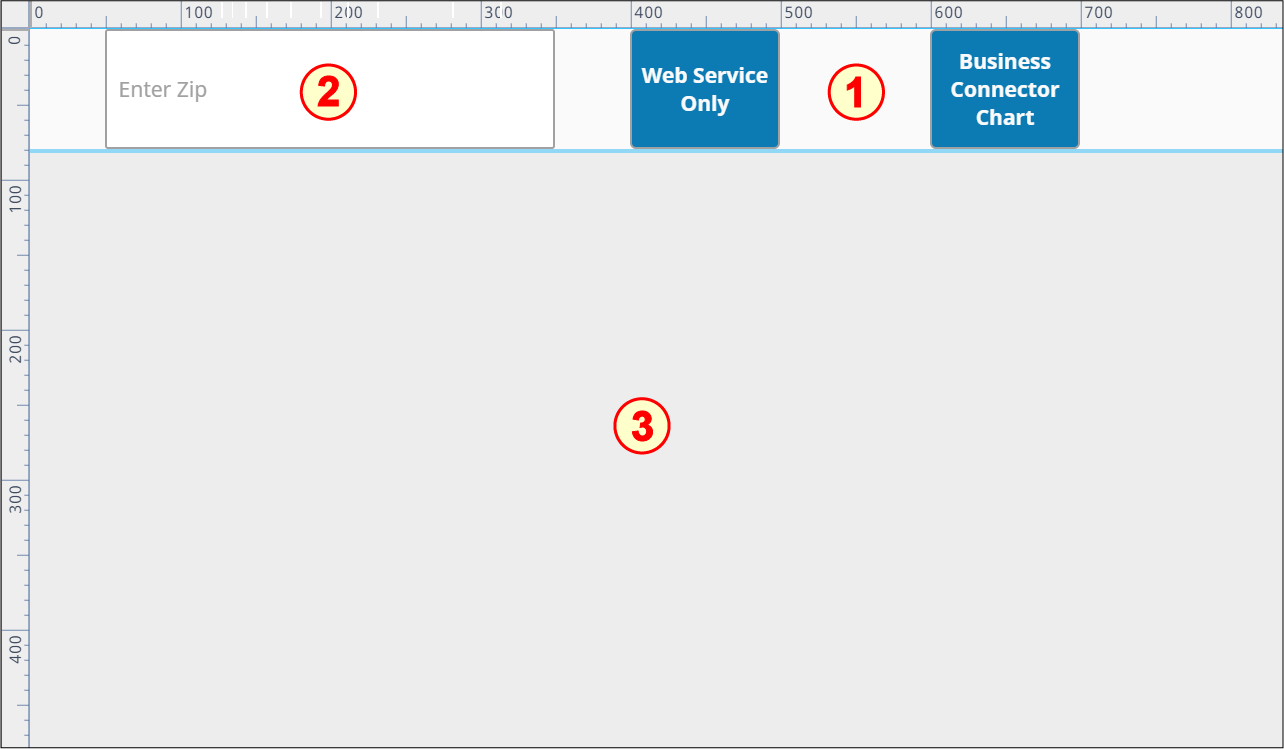
The WeatherRestAPI view has three main components:
- Button (Ignition)
- Text Field (Ignition)
- Map (Ignition)
Configure Business Connector Chart Button to Execute Chart
Set up the Business Connector Chart button script to execute the GetWeatherByZip chart, which will call the getWeather API and return an Ignition dataset.
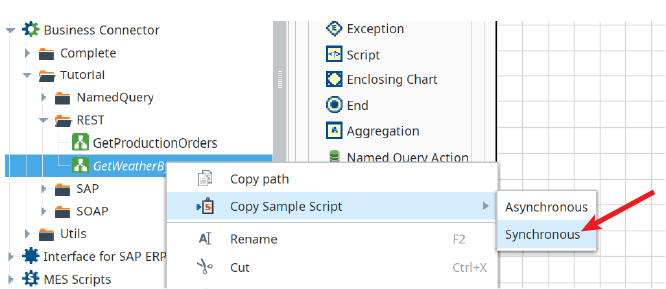
- Navigate to the Business Connector chart GetWeatherByZip. Right-click on the chart name in the Project Browser and select Copy Sample Script → Synchronous, as shown to the right.
- Open the WeatherRestAPI view in your Tutorial folder. It has two Button components, one that will be configured to run the getWeather API directly, and another to run it via a Business Connector chart. It also has a Text Field component to collect a zip code. The Map component will display a Google map image for the location selected.
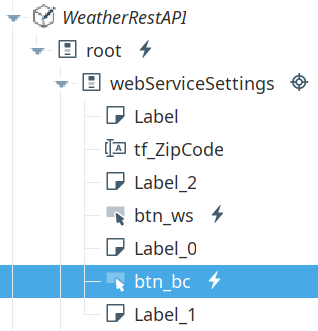
- Open root → webServiceSettings. Right-click on btn_bc and select Configure Events from the menu. A partially-built script has been provided in the onActionPerformed event.
In place of the six quotes and "Call BC Chart here" on lines 4-8, paste in the synchronous sample script you just copied from the GetWeatherByZip chart. It should look like this:
Sample chart script
PythonchartPath = 'Complete/REST/GetWeatherByZip'
#Optional. Used to override default parameter values
parameterValues = {
'zip' : self.getSibling("tf_ZipCode").props.text
}
#Python list of chart parameters to retrieve values for. Pass in '*' to return all.
returnThese = ['city', 'lat', 'lon', 'temp', 'humidity']
#Executes and waits for the chart to complete before control returns to the script.
returnedParams = system.mes.bc.executeChartSynchronous(chartPath, parameterValues, returnThese)
city = returnedParams['city']
lat = returnedParams['lat']
lon = returnedParams['lon']
temp = returnedParams['temp']
humidity = returnedParams['humidity']
#center on lat/lon
self.parent.parent.getChild("Map").props.init.center = {
"lat": float(lat),
"lng": float(lon)
}
#add marker and pass params to view
self.parent.parent.getChild("Map").props.layers.ui.marker[0] = {
"name": "",
"lat": float(lat),
"lng": float(lon),
"opacity": 1,
"icon": {
"path": "material/location_on",
"color": "#4190F7",
"size": {
"width": 36,
"height": 36
},
"style": {
"classes": ""
}
},
"tooltip": {
"content": {
"text": city,
"view": {
"path": "Embedded/WeatherPopup",
"params": {
"temp": temp,
"name": city,
"humidity": humidity,
}
}
},
"direction": "auto",
"permanent": False,
"sticky": False,
"opacity": 1
},
"popup": {
"enabled": False,
"content": {
"text": "",
"view": {
"path": "",
"params": {}
}
},
"width": {
"max": 100,
"min": 50
},
"height": {
"max": None
},
"pan": {
"auto": True
},
"closeButton": True,
"autoClose": True,
"closeOnEscapeKey": True,
"closeOnClick": None
}
}- In the input parameters area of the chart execution statement, replace the empty string assignment for zip with the following, which will be used to capture the user-entered zip code in the Text Field:
self.getSibling("tf_ZipCode").props.text
The edited line should look like this:
'zip' : self.getSibling("tf_ZipCode").props.text} - The dataset returned by the weather API has been mapped in the chart to the output chart parameters. We need to pass these to the Map component on the Perspective view, so it can display a geographic map centered at our coordinates. Replace the five lines under the comment "Variables from BC Chart data" with the lines below, so that values passed to the Map component will be coming from the weather API (via the chart's output parameters) instead of just being fixed values.
city = returnedParams['city']
lat = returnedParams['lat']
lon = returnedParams['lon']
temp = returnedParams['temp']
humidity = returnedParams['humidity']
Note that the lines under the comment "center on lat/lon" will cause the Map component to display a map centered on the latitude and longitude provided by the getWeather API.
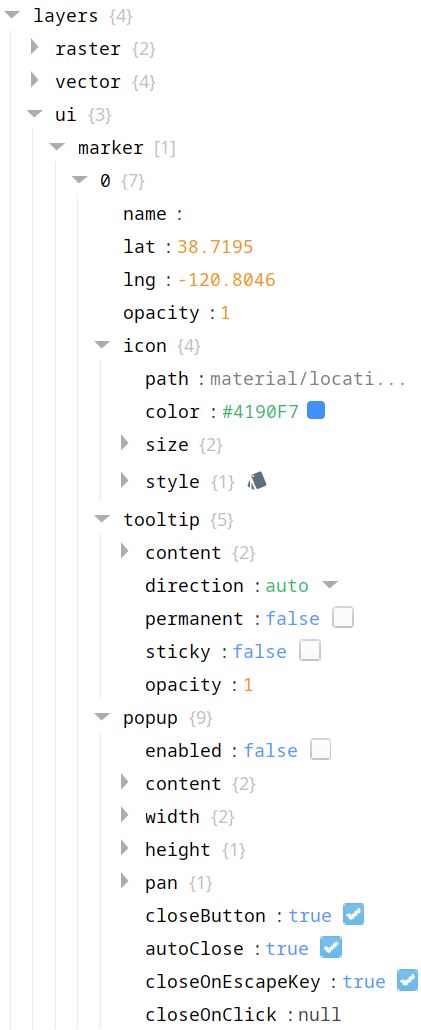
Note also that the script command under the comment "add marker and pass params to view" will cause the Map component to display a marker pin configured with the values specified (including the same latitude and longitude values). The marker's optional hover tooltip is also configured to display the city and the current temperature and humidity. The command populates the property fields in the Map component shown to the right (layers → ui → marker in the PROPS area in Designer).
The completed script should look like this
Python |
chartPath = 'Complete/REST/GetWeatherByZip' |