Create TagHistorianData Perspective View

Completing Call Business Connector Chart

For time savings, this View has been mostly pre-built and only requires students to complete it by adding script functionality to the Call BC Chart button.


Complete Call BC Chart Button Script

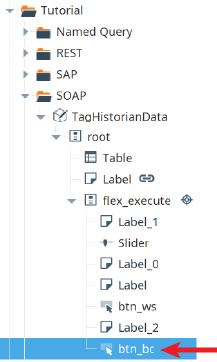
  • In the Perspective → Views → Tutorial → SOAP folder, open the View called TagHistorianData.

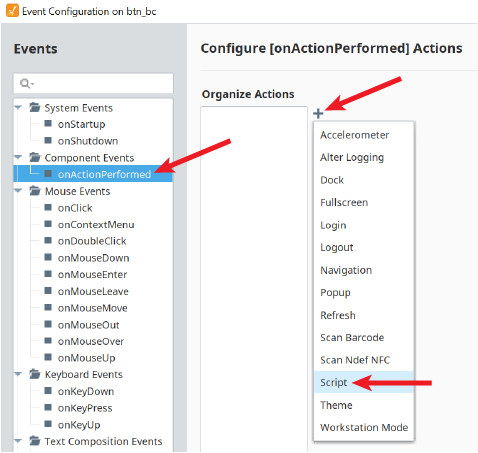
  • Expand the View in the Project Browser, right-click on btn_bc and select Configure Events...

  • Add the following script to the onActionPerformed event, to complete the Call BC Chart (btn_bc) button functionality.


Script for Call BC Chart Button

Python
    end = system.date.now()
start = system.date.addMinutes(end, -int(self.getSibling("Slider").props.value))

chartPath = 'Complete/SOAP/TagHistoryAverage'
#Optional. Used to override default parameter values
#parameterValues = None
parameterValues = {
'tagPaths' :
{'tagPathsRoot' :
{
'Tank1Path': "[default]New Enterprise/Site 1/Tank 1 Level",
'Tank2Path': "[default]New Enterprise/Site 1/Tank 2 Level",
'Tank3Path': "[default]New Enterprise/Site 1/Tank 3 Level",
'Tank4Path': "[default]New Enterprise/Site 1/Tank 4 Level",
'Tank5Path': "[default]New Enterprise/Site 1/Tank 5 Level"
}
},
'startDate' : start,
'endDate' : end
}
#Python list of chart parameters to retrieve values for. Pass in '*' to return all.
returnThese = ['TagResponseData']
#Executes and waits for the chart to complete before control returns to the script.
returnedParams = system.mes.bc.executeChartSynchronous(chartPath, parameterValues, returnThese)

dict = returnedParams['TagResponseData']['TagResponseDataRoot']
data = []

for key in dict.keys():
value = dict[key]
data.append({'Tank':key,'Value':value})

self.parent.parent.getChild("Table").props.data = data