Creating TagHistoryAverage Chart
This exercise requires a Business Connector chart to call the SOAP Consumer TagHistoryAverage you previously created.
Create TagHistoryAverage Chart
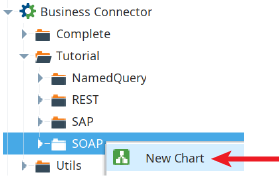
- In the Business Connector section of the Project Browser, navigate to the Tutorial → SOAP folder. Right-click and select New Chart. Name the new chart TagHistoryAverage.
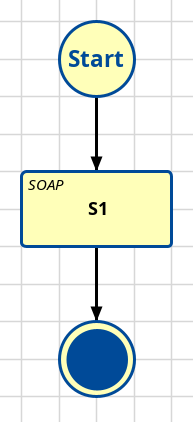
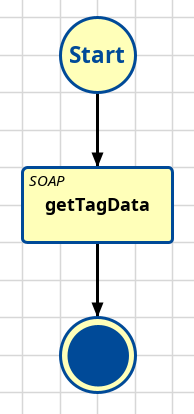
- Drag on and connect a SOAP Action Block.
- Drag on and connect an End Block.

Configure Start Block
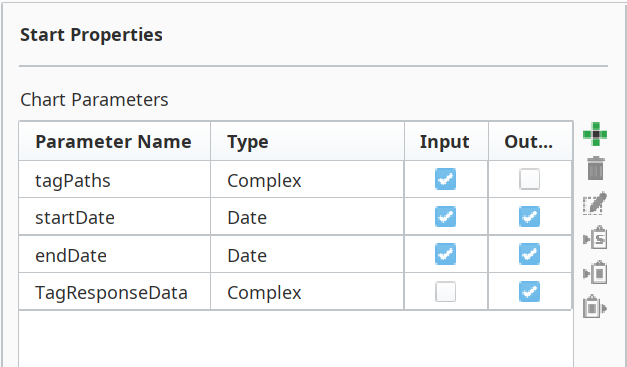
We will both pass in and return data, so let's create the chart parameters for this next.
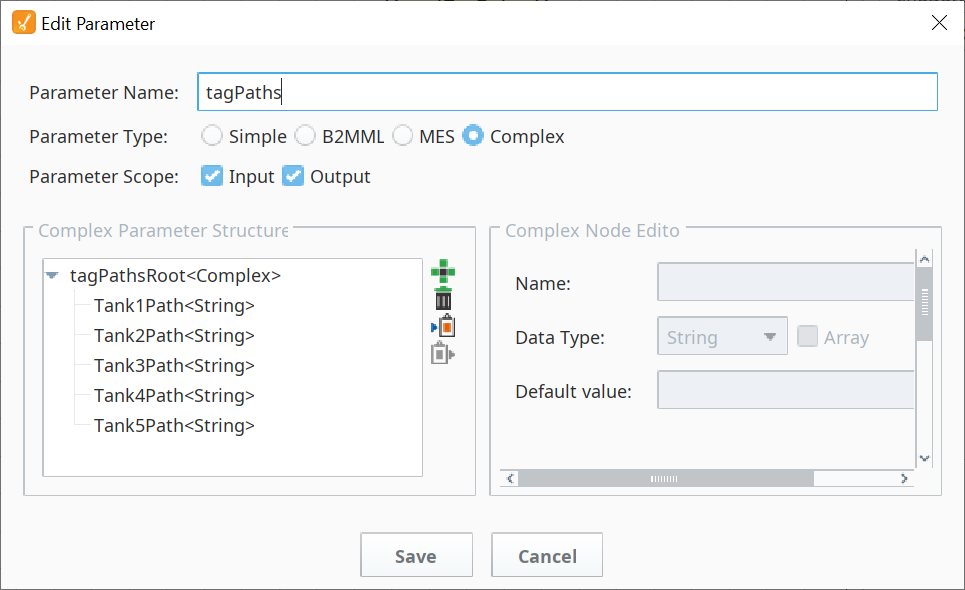
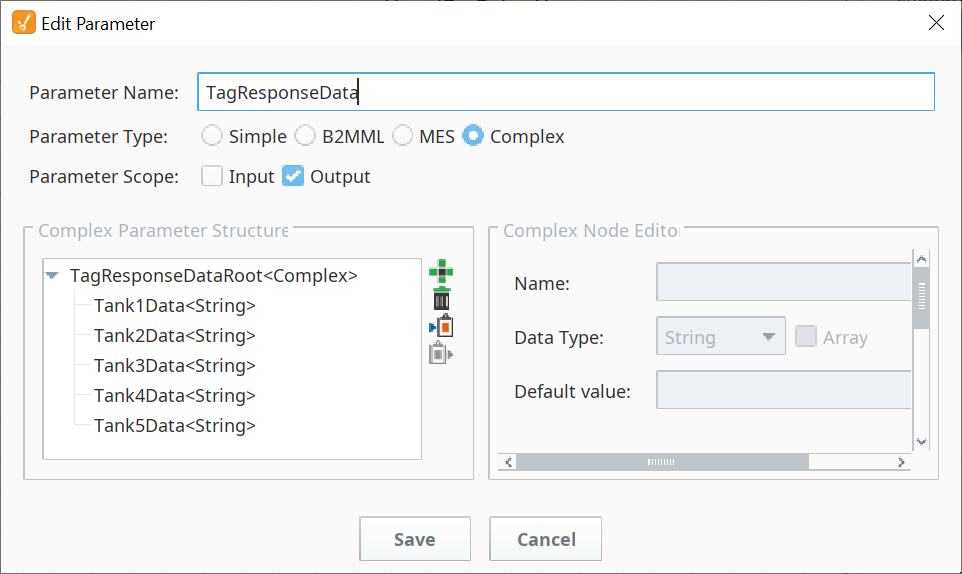
- Click on the Start Block and create the list of chart parameters as shown below. Make sure to select/deselect the Input or Output checkboxes for each parameter, as appropriate. The two complex parameters are shown as completed, to the right.
Configure SOAP Action Block
We need to point the SOAP Action Block to our previously-created SOAP Consumer and then map the inputs and outputs needed to support it.
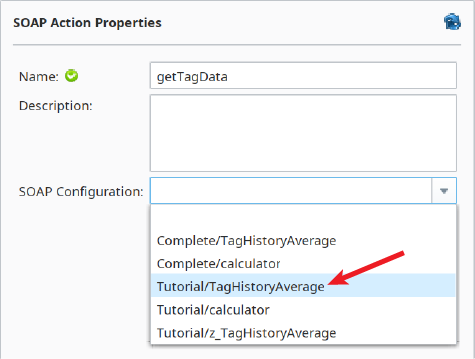
- In the Name field of the SOAP Action Block, name the block getTagData.
- In the SOAP Configuration field, select the SOAP Consumer you built earlier (Tutorial/TagHistoryAverage).
TagHistoryAverage Chart
Map Inputs
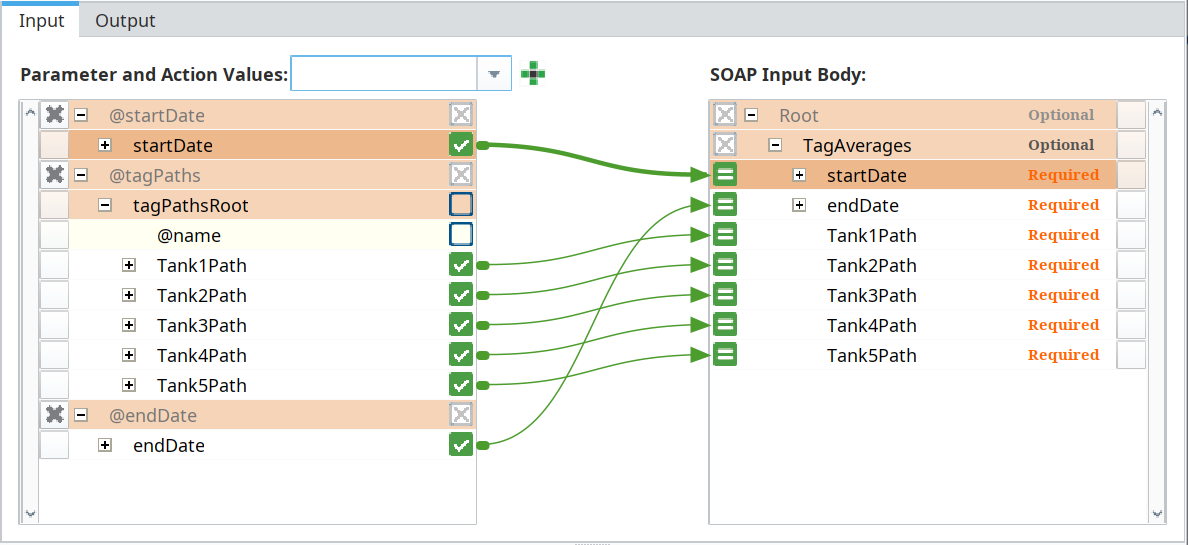
- In the mapping area, select the Input tab and add the chart parameters @startDate, @endDate and @tagPaths.
- Expand these three, as well as Root in the SOAP Input Body on the right (which holds the SOAP Request Message complex parameter TagAverages) and drag all of the connections shown below.
The completed input mapping should look as shown below:
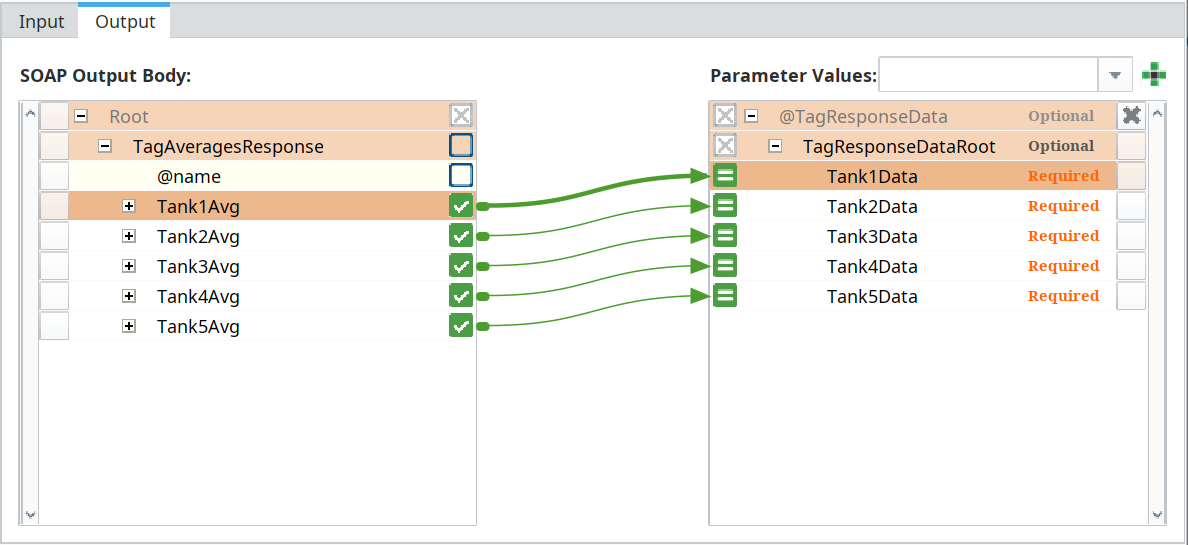
Map Outputs
- Add the parameter @tagResponseData from the drop-down list on the right.
- Expand and connect both sides as shown below.
The completed input mapping should look as shown below: