Configure Live Analysis
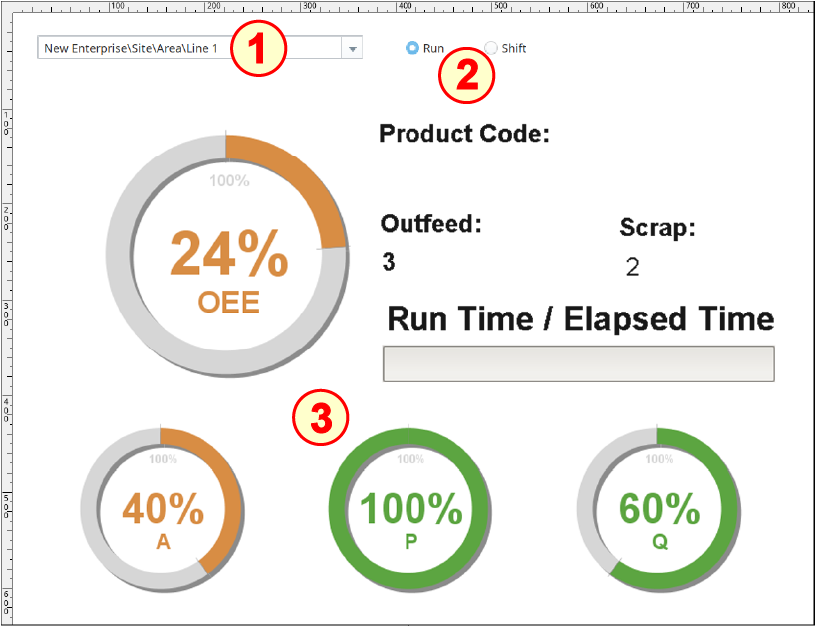
The Live Analysis-driven Dashboard on the window OEE_01_GUI/04_Reporting has four main components:
- MES Object Selector
- Two Ignition Radio Buttons
- Basic_LiveAnalysis (previously-built template)
Configure MES Object Selector
- Drag an MES Object Selector component onto the window and place it in the upper-left corner, as shown above. Drag the size out to about four times its original width.
- In the MES Object Selector component properties, set the checkboxes for Include MES Line Objects and Show Equipment Path.


Configure Radio Buttons
- Drag two Radio Buttons onto the window and position to the right of the MES Object Selector. Configure as follows:
- Rename the left button to rbn_Run.
Set the Text property to Run. - Rename the right button to rbn_Shift.
Set the Text property to Shift.
- Rename the left button to rbn_Run.

Configure Basic_LiveAnalysis
Basic_LiveAnalysis is an instance of a 'template' stored in the Templates folder of the Project Browser in Ignition Designer.
Open the Templates folder (close to the bottom of the Project Browser pane). Drag the Basic_LiveAnalysis template onto the window (click and drag the name Basic_LiveAnalysis). Designer will place an instance of the template onto the window at the spot of the mouse button release. Its elements will remain 'grouped' and can be moved and resized as a group as if it were a single component.

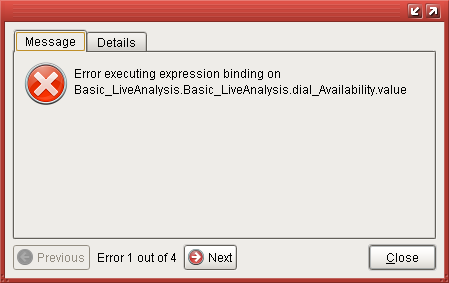
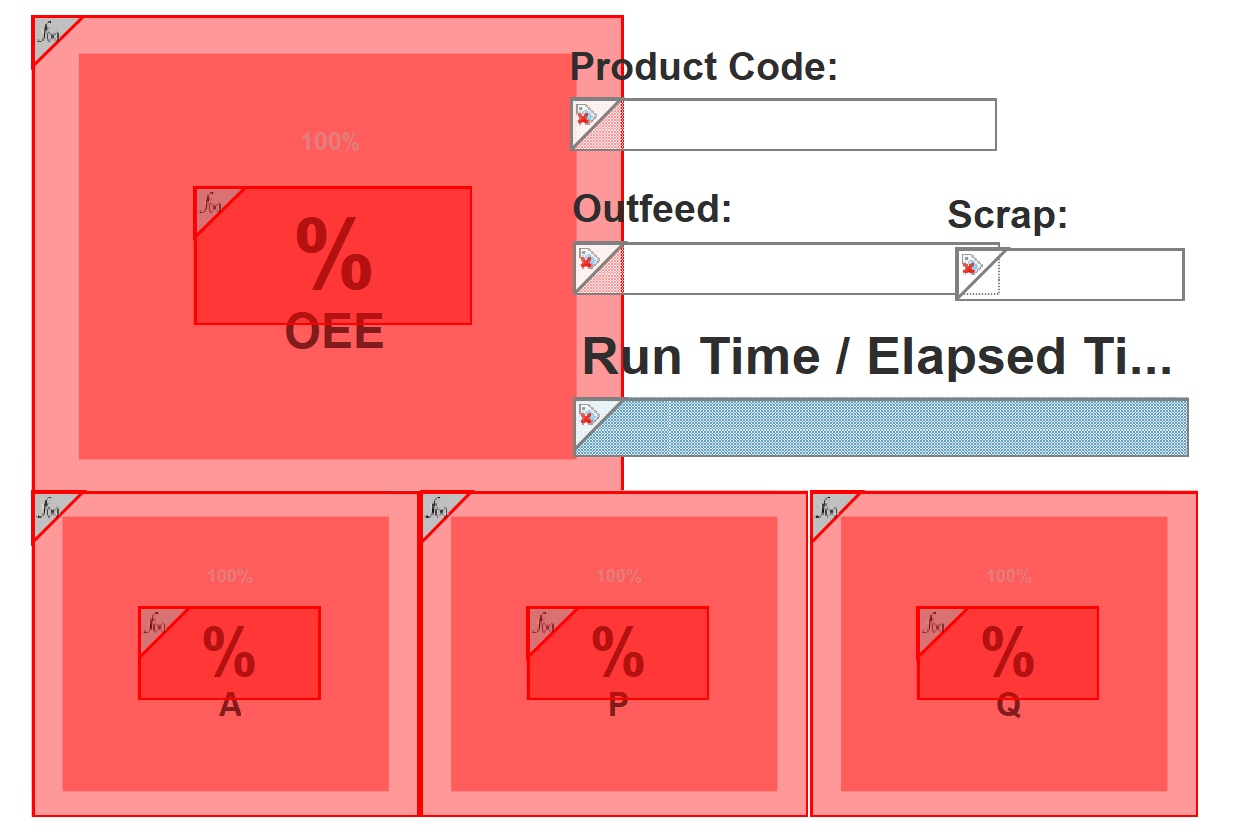
Ignore the initial error message(s) that pop up. Once properly configured and a Line is selected in the MES Object Selector, the error messages will stop and the Basic_LiveAnalysis template will no longer be red.
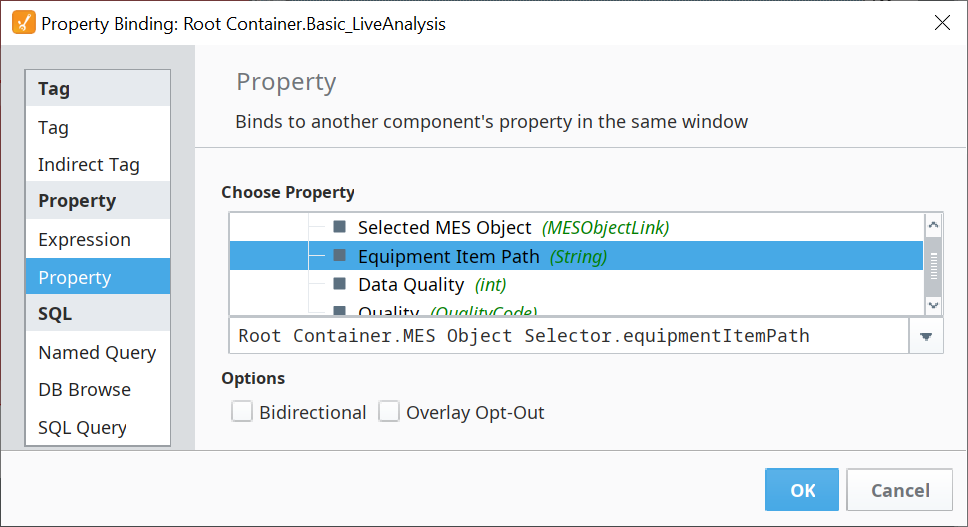
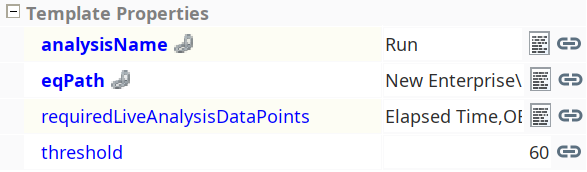
- In the Basic_LiveAnalysis properties, bind the eqPath property to the Equipment Item Path property of the MES Object Selector.
Bind the analysisName property to the following expression:
Selection Mode expression
Pythonif({Root Container.rbn_Run.selected}, "Run", "Shift")Paste the following list of Live Analysis Data Points into the requiredLiveAnalysisDataPoints property:
requiredLiveAnalysisDataPoints
PythonElapsed Time,OEE,OEE Availability,OEE Performance,OEE Quality,Product Code,Runtime,Unplanned Downtime,Work Order,OEE Outfeed Count,OEE Infeed Count,OEE Reject Count

When pasting the list of Live Analysis Data Points above into the requiredLiveAnalysisDataPoints property, make sure you do not include any trailing spaces, or you will not get data on your dials.
- Set the threshold property to 60.
![]()
Create a Live Analysis
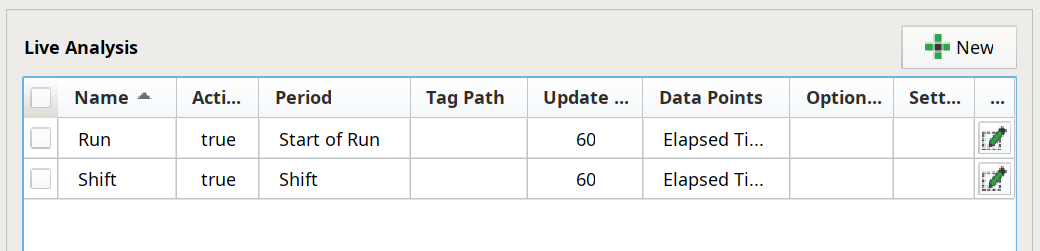
- Let's create a Live Analysis for Run and another for Shift, so we have some OEE data being gathered that we can view with the Basic_LiveAnalysis template component we just installed:
- Navigate to the Line 1 entry in the MES Equipment Manager. Click Live Analysis in the General section.
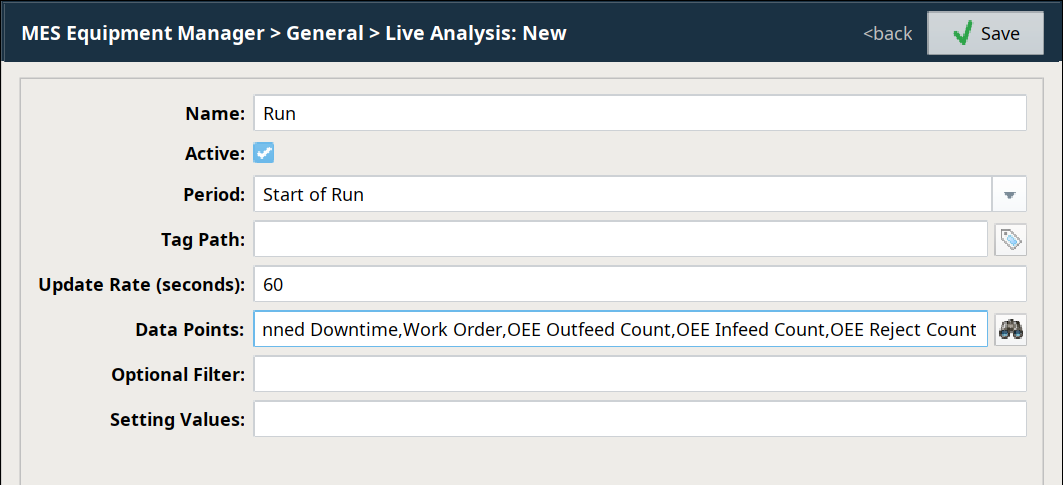
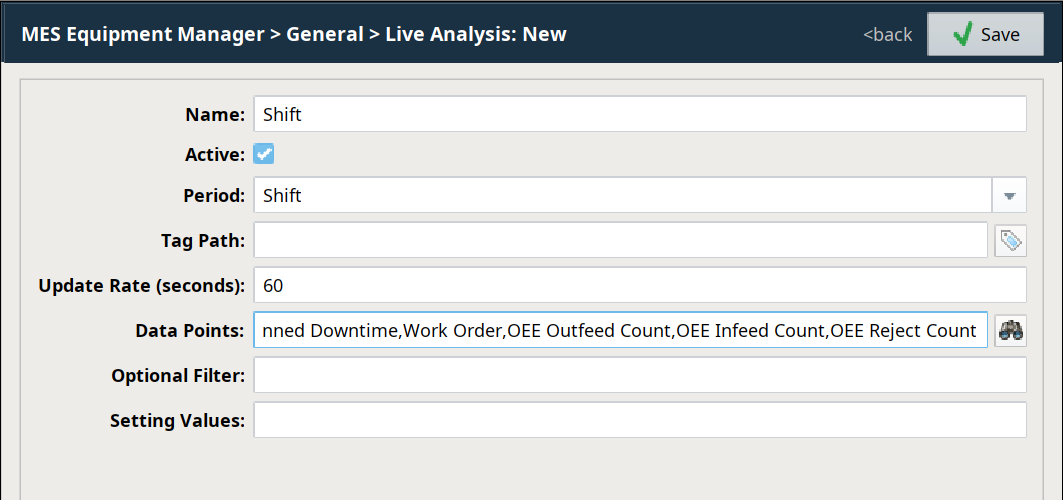
- For each of the two Live Analysis entries you will create, do the following, using the values from the table below:
- Click New (
 ).
). - Type in the Analysis Name.
- Select the appropriate Period from the drop-down list.
- Set the Update Rate.
- Paste in the Live Analysis Data Points from the text list in the requiredLiveAnalysisDataPoints box above.
- Click Save to create the new Live Analysis.
- Click New (
- Copy/paste the Run and Shift analyses into Line 2.
|
When pasting the list of Live Analysis Data Points above into the Data Points field of your new Live Analysis, make sure you do not include any trailing spaces, or you will not get data on your dials. |
| Live Analysis → | Run | Shift |
|---|---|---|
| Analysis Name | Run | Shift |
| Period | Start of Run | Shift |
| Update Rate | 60 | 60 |
| Data Points | (paste in list above) | (paste in list above) |
![]()