Configure MES Analysis Selector and Live Analysis
In this section we will explore two ways to perform analysis, one on screen (Perspective MES Analysis Selector, Vision MES Analysis Selector), the other through the MES Tag provider using Live Analysis.
The MES Analysis selector is an engineering tool for creating custom analysis calls. By simplifying SQL type queries in the UI, the MES Analysis Selector opens up the analysis engine (and in so doing, lots of SPC data) for dashboards, reports, and other uses. To learn about the MES Analysis Selector, we'll build a simple screen with the component and a table to show results.
After we have configured the MES Analysis Selector, we'll set up tag output of SPC data through Live Analysis. Once analysis values for SPC are present in the tag server, we can bind on-screen display to tags or utilize other Ignition features, such as the Alarm System, for those tags.
Configure MES Analysis Selector
- On the Analysis screen, place the MES Analysis Selector (from the Production section of the component pallet).
- Note the properties of the component, specifically the start and end timestamps for analysis calls and the message/warning features. If there is a problem with the analysis, a message will appear there.
- Place a table on the screen. Note that the MES Analysis Selector has slide out panels in Vision, so the Z order must be at the top.
- Bind the data property of the table to the data property of the MES Analysis Selector so that analysis result data is displayed on screen in the table.
Configure an SPC Analysis within the MES Analysis Selector
The MES Analysis Selector provides for the creation of new analysis calls as well as the editing and execution of previously configured calls. Follow these steps to configure a new Analysis Setting.
- Selecting the green plus icon, create a new Analysis Setting. Give it a meaningful name, giving care to the fact that other users may access the settings. As a best practice, prepend the name indicating the point of use, e.g. "Report_pH Testing" or "Dashboard_pH Testing". Go ahead and use "Dashboard_pH Testing" for the present example.
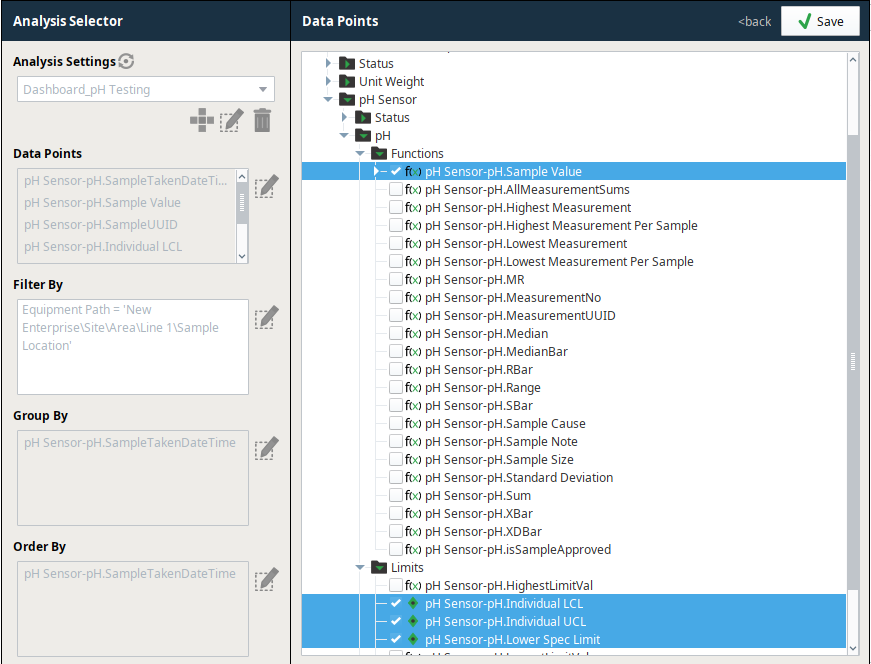
- Next, select the Data Points from the data point edit dialogue. Navigate to the pH Sensor folder under SPC, expanding the pH folder, and Functions, before selecting "pH Sensor-pH.Sample Value". You will also need to select the timestamp of collection, "pH Sensor-pH.SampleTakenDateTime", which is not under the Functions folder. Continue with this process for the Control Limits utilized in the sample as well as the Spec Limits configured for the example.
- Next, edit the Filter By criteria. This feature tells the analysis engine the search criteria for the data we wish to return. Always start with an equipment path filter. For this example type or use the selection interface to achieve this filter clause: Equipment Path = 'New Enterprise\Site\Area\Line 1\Sample Location'
- Next, edit the Group By criteria. Group By determines the logic within the analysis engine for when a new row is returned in the analysis results. For every value of the Group By item (or items), a new row of data will be calculated. For this example select "pH Sensor-pH.SampleTakenDateTime". Therefore this analysis will have a new row for each sample.
- Optionally configure the Order By field, using the SampleTakenDateTime is suggested.
Vision example screenshot of data point selection.
Configure Live Analysis
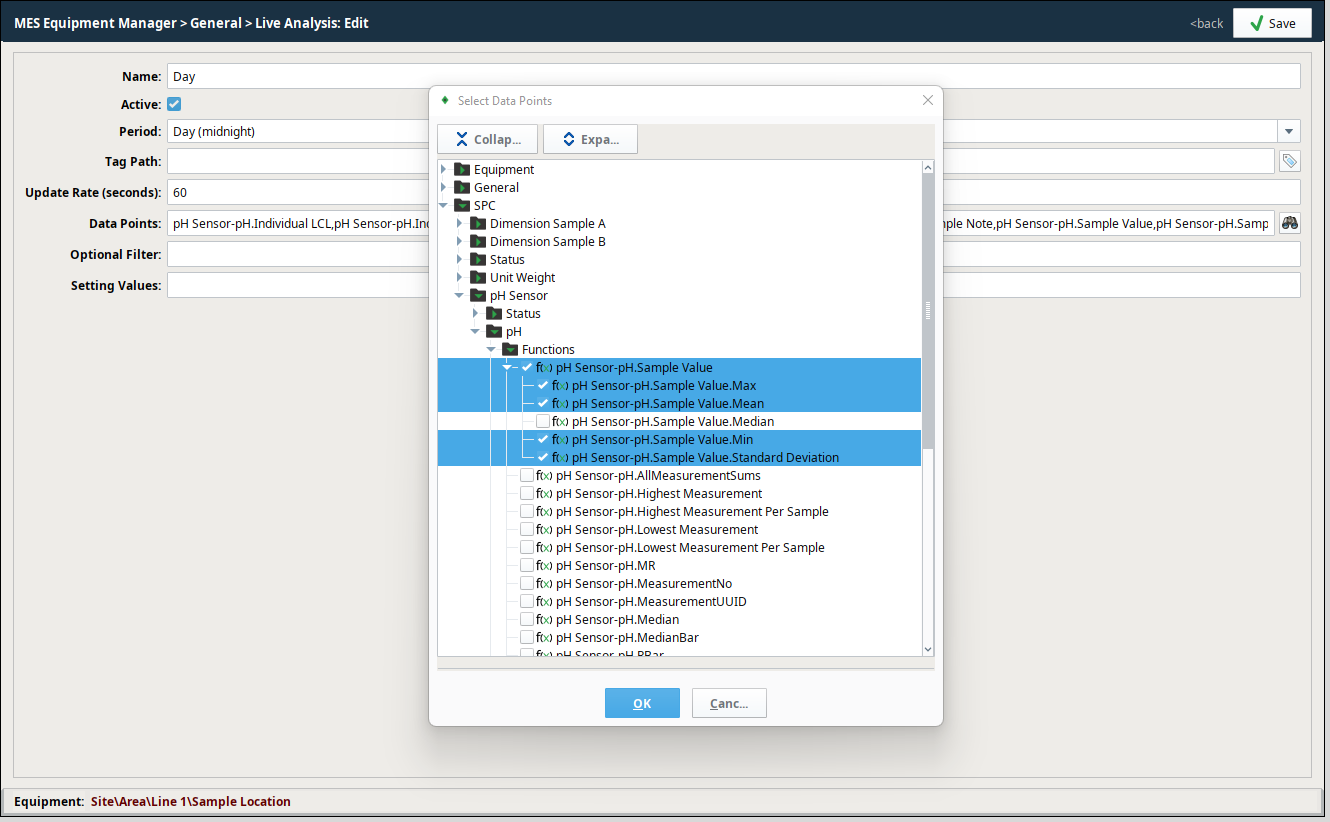
The MES Equipment Manager allows for the configuration of Live Analyses on equipment. The selection interface for data is very similar to the MES Analysis Selector data point selection interface. The major difference is that Live Analysis returns current values to tags. Follow the steps to configure Live Analysis via the video at right. While the video is for OEE, in our example, explore the SPC values. An example image during the set-up process (within the MES Equipment Manager) for SPC is shown at right for reference.
Tag values will be published to the MES tag provider in the equipment hierarchy according to the name of the Live Analysis configured. In the present scenario, the Live Analysis is called "Day".