Enter pH Samples
- Input about a dozen float values between about 5.0 and 9.0 into the pH Sensor field, in order to drive sample collection. The values will begin to appear on the Easy Chart.
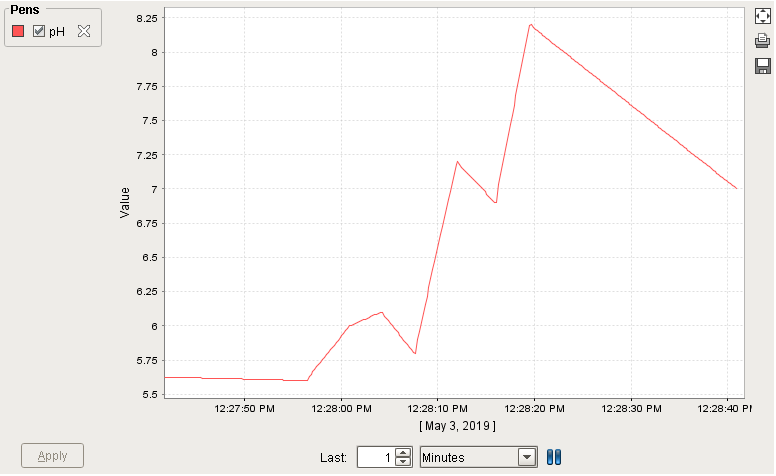
View on Easy Chart
- Set the Last field on the Easy Chart to 1 or 2 minutes.
- Review the data on the Easy Chart (retrieves the pH Tag history via the Ignition Tag Historian). You should see it slowly scrolling the sample values to the left.
- Experiment with different Last settings, as well as changing the Chart Mode to Manual and Historical.
- Right-click anywhere inside the chart area. Experiment with the available menu options:
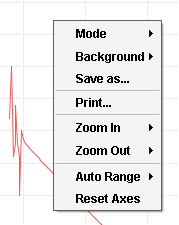

|
Compare the Easy Chart to what you'll see in the next step of this tutorial which utilizes a Control Chart. |
![]()
![]()
Note that Tag Sample Collectors are simple and flexible to configure. A Tag Sample Collector is a great way to "set it and forget it" for pertinent values that need sampling. Expression Tags can be used as an intermediate logical interface between OPC tags (typically from a PLC) and the SPC Tag Sample Collector configuration, allowing additional logical controls on Sample collection. Info on the Ignition Tag Historian for Tag sample collection is here.