Sepasoft MES Module Suite
The Histogram Chart is an analysis chart type.
Sample Definition Settings for Histogram
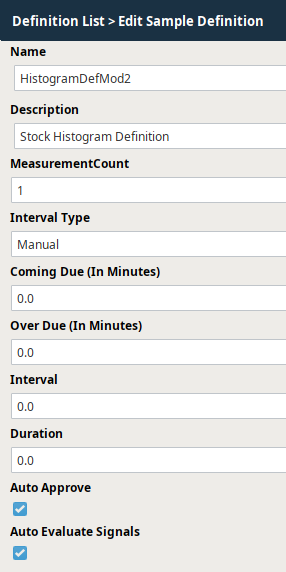
In the Sample Definition Manager, add or edit a sample definition. To learn about how to do this, see Sample Definitions.
Below is an example of how the settings could be configured for this type of chart.
Sample Definition Settings for Histogram | Attributes
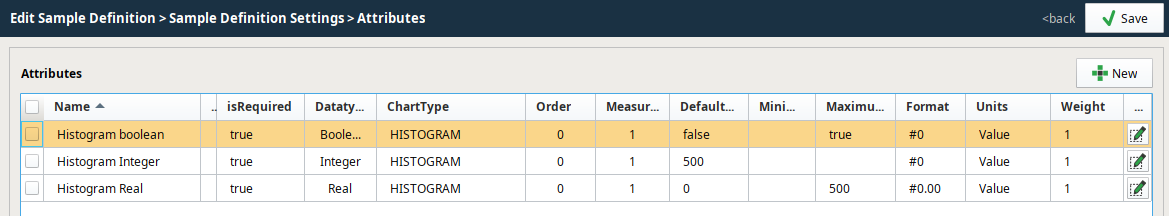
| Possible Data Types | Minimum Measurement |
| Integer | 1 |
| Real | |
| Boolean |
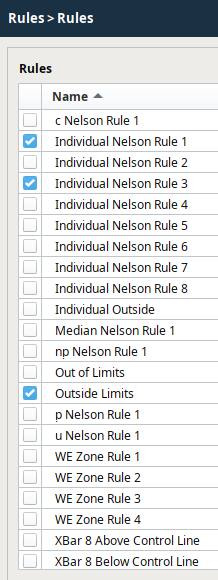
Sample Definition Settings for Histogram Chart | Rules
Sample Definition Settings for Histogram Chart |Control Limits
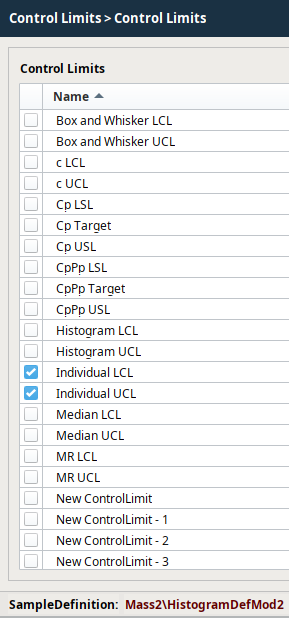
| Control Limits |
|---|
| Individual LCL |
| Individual UCL |
After all the desired settings have been defined, select Save to commit all the changes or Cancel to undo any changes that have been made. After a Sample Definition has been created, samples based on them may begin to appear or can be manually added depending on the Interval setting.
Sepasoft MES Module Suite