Sepasoft MES Module Suite
Trace Graph
The Trace Graph component provides a visual method to understand what material lots and processes were used to create Finished Goods.
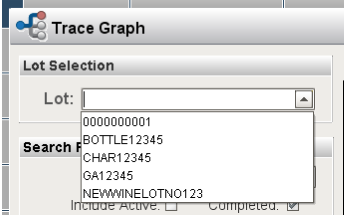
To use the Trace Graph simply select a From Date Time and a To Date Time to look up all of the lot numbers in that time period. You can filter for specific equipment or material and you can specify whether or not you want to see active or completed lots. Once you select your filters, you should be able to see a list of lot numbers in the dropdown list.
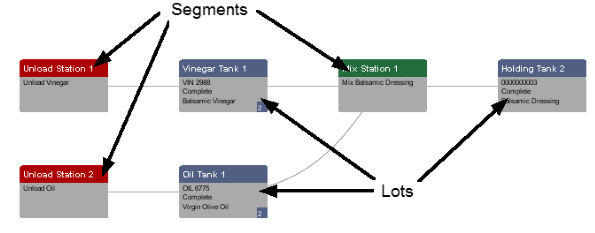
The nodes are laid out in chronological order from left to right. The node type alternates starting with a segment then showing a lot. The idea behind this is there are lots that are inputs to an operation and there are lots that the operation produced. In the image below, the upper left node titled Unload Station 1 is the operation that vinegar was unloaded. When this operation was done, a new lot VIN 2988 was created. Then that lot was used in the operation of making of balsamic dressing at Mix Station 1, which produced balsamic dressing that resides in Holding Tank 2.
Example trace graph for Lot No 0000000001.
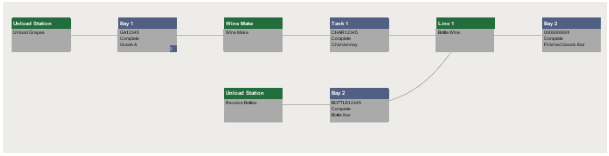
You can click on any node to view the corresponding details.
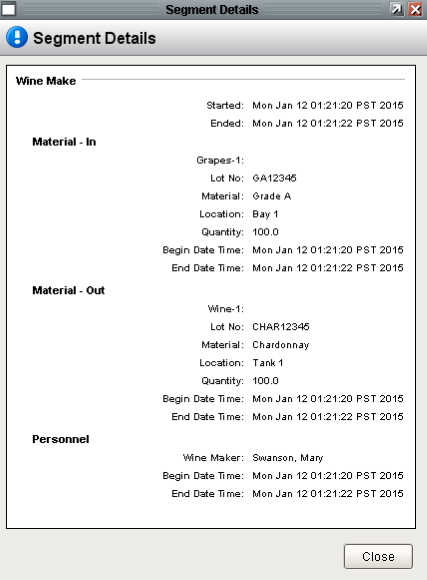
Optionally, you can click on individual nodes to allow the trace to start inspecting that Lot No. This would give the details about the raw materials, finished goods, and much more. To view the data in tabular form, click on the Table tab.
Sepasoft MES Module Suite