Creating a Business Connector Chart
Create a Business Connector chart called GetWeatherByZip to execute the RESTful Consumer getWeather that you created earlier. The chart maps in data from a Perspective view called WeatherRestAPI that you will create next to execute the chart. The chart will then map out results returned by the online weather API and display the results graphically using the Ignition Map component.
Assemble Chart Blocks
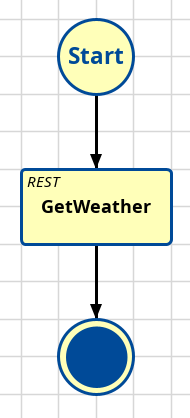
- Drag on a RESTful Action Block and an End Block. Connect them together as shown to the right.
- Rename the Restful Action Block to GetWeather.
Configure Start Block
The chart will pass parameter zip (which comes from the Text Field on the Perspective view WeatherRestAPI) into the RESTful Consumer getWeather. Some of the returned data from the online weather API will be parsed and presented as output chart parameters for the Map component to display.
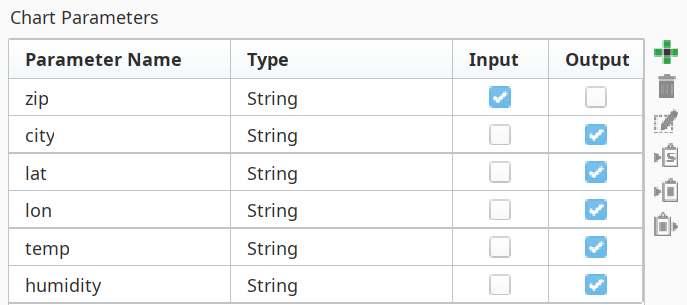
- Create six new chart parameters, all as type String. Name them as shown to the right.
- Set the Input and Output checkboxes as shown.
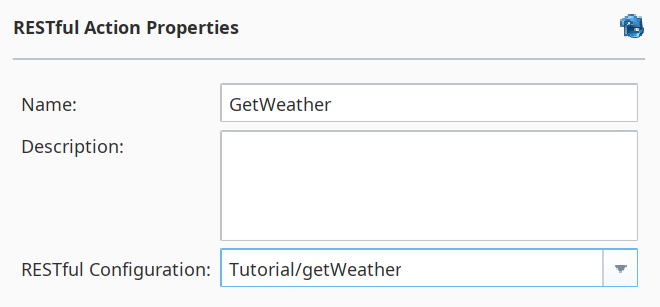
Configure RESTful Action Block
We need to point the RESTful Action Block to our previously-created RESTful Consumer and then map the inputs and outputs needed to support it.
- In the RESTful Configuration field, select the RESTful Consumer getWeather that you built earlier.
Map Inputs
- In the mapping area, select the Input tab and add the chart parameter @zip.
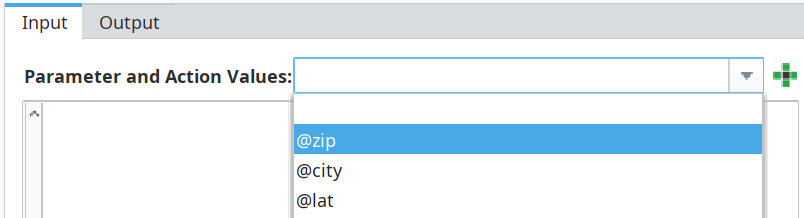
- Expand both @zip and Root in the RESTful Request and drag a connection from zip to zip.
Set units to the fixed value Imperial.
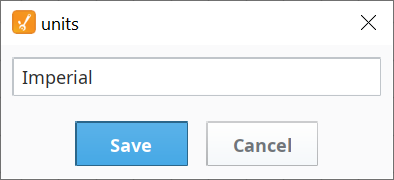

This fixed value assignment will overwrite any default value or binding in the RESTful Consumer getWeather. It isn't needed here, since the default value for units set in the consumer is already "Imperial", but it's being shown to illustrate that mapping connections made in the RESTful Action Block will overwrite values set in the Request Message of a RESTful Consumer.
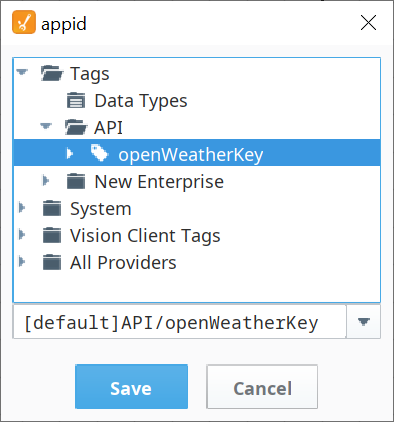
Bind appid to the tag openWeatherKey that holds your account key, as shown to the right.
This binding will overwrite any default value or binding in the RESTful Consumer getWeather. It isn't needed here, since appid already points to the key we want, but it's being shown to illustrate that mapping connections made in the RESTful Action Block will overwrite values set in the Request Message of a RESTful Consumer.
The completed input mapping should look as shown below: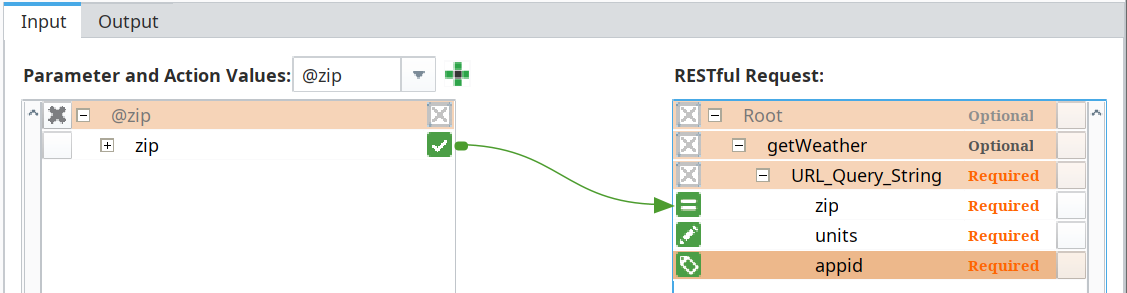
Map Outputs
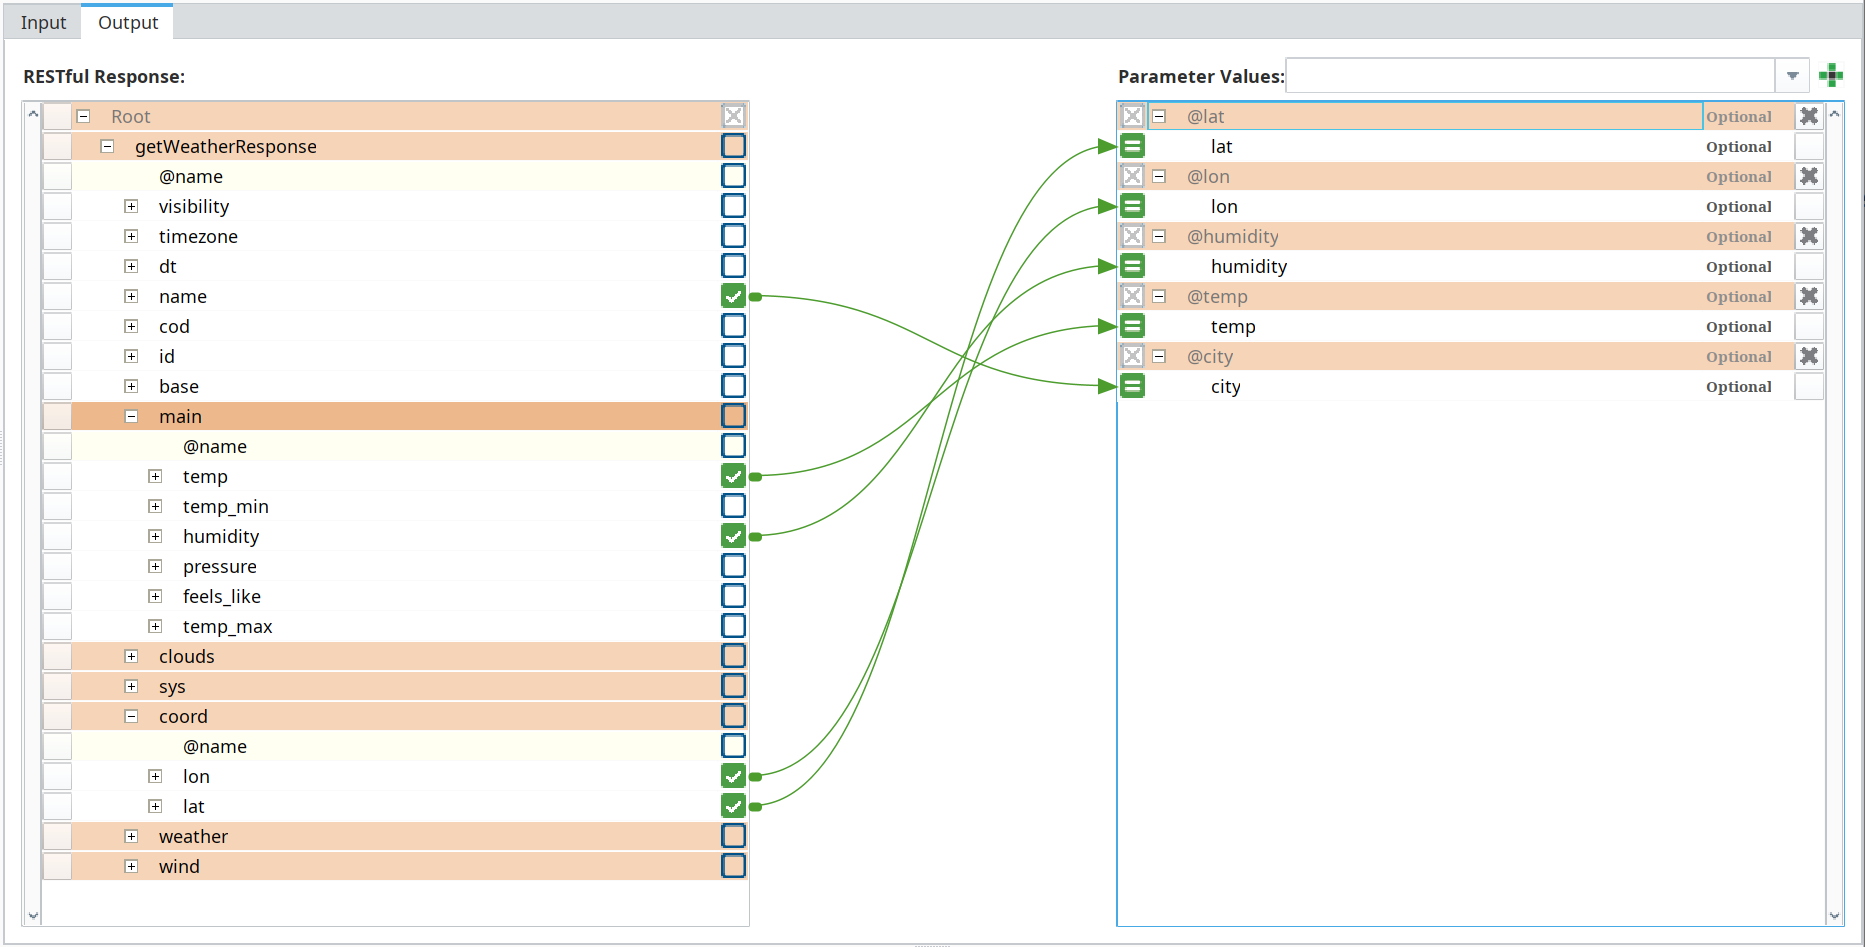
- In the mapping area, select the Output tab.
- Add the five output chart parameters to the destination side of the mapping area: @city, @temp, @humidity, @lon and @lat. The order doesn't matter.
- Expand and drag connections as shown below (note: @name on the left contains the city name from the weather app). This passes values from the dataset returned by the weather app to the chart output values created in the Start Block, which we will pass to the Map component in the Perspective view WeatherRestAPI using script in the Business Connector Chart button.
The completed output mapping should look as shown below: