Sepasoft MES Module Suite
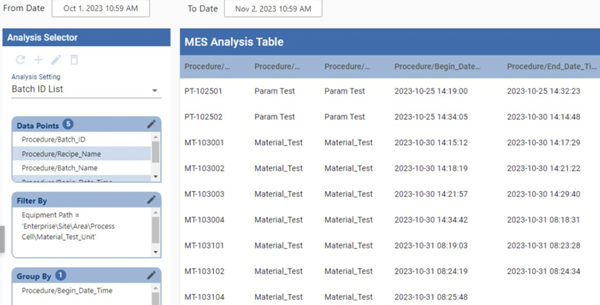
Analysis Selector
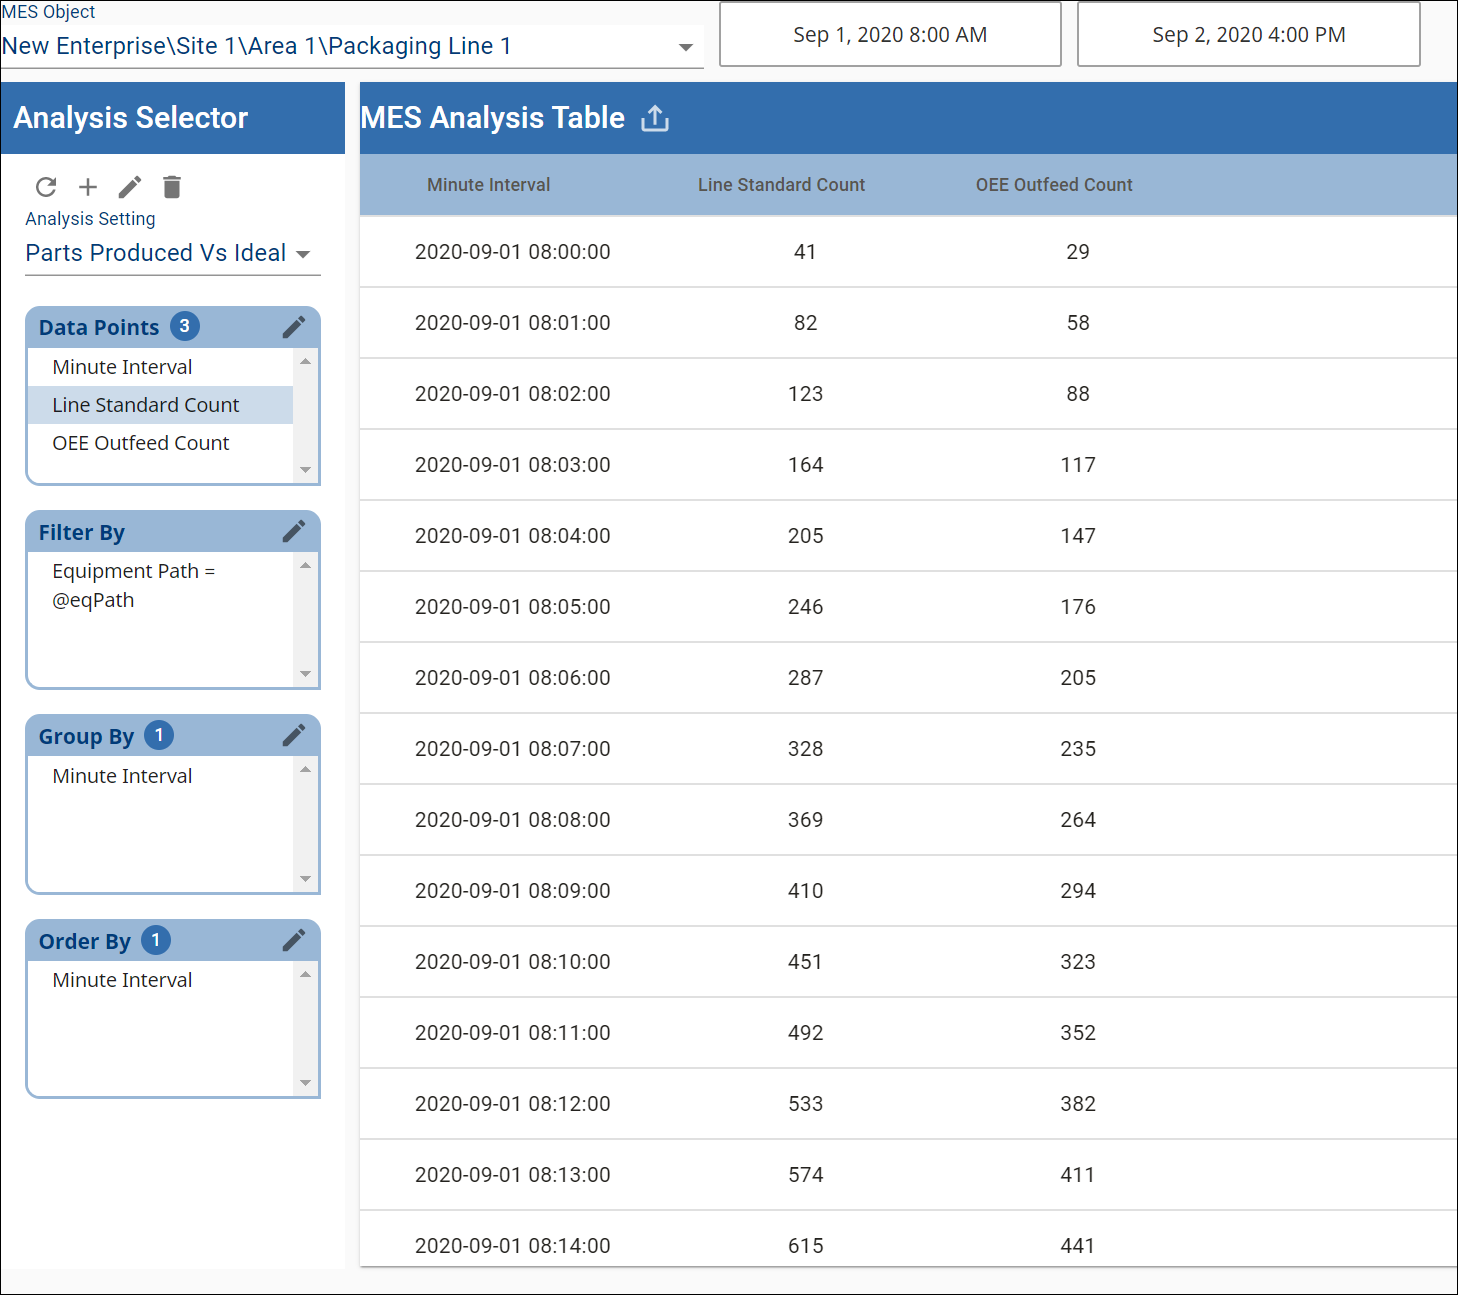
This component allows for ad hoc selection of analysis data. Results are displayed based on the selected Data Points, Filter By, Group By and Order By settings.
This topic includes:
- Equipment Cell Order
- Equipment Name
- Equipment Note
- Equipment Operation Begin
- Equipment Operation End
- Equipment Operation Original Begin
- Equipment Operation Original End
- Equipment Operation Scheduled Begin
- Equipment Operation Scheduled End
- Equipment Operation Sequence
- Equipment Path
- Equipment Type
- Execution Time (ms)
- Infeed Units
- Is Key Cell
- Operation UUID
- Outfeed Units
- Product Code
- Rate Period
- Reject Units
- Work Order
- TimeStamp
- Min
- Max
- Median
- Mean
- Standard Deviation
- TimeStamp
- Equipment/Count
- Equipment Infeed Scale
- Equipment Package Count
- Equipment Reject Scale
- Counter Name - Counter Kind
- Equipment/Cycle Time
- Equipment/Cycle Time/Normal
- Equipment/Cycle Time/Overall
- Equipment/Cycle Time/Precise
- Calculation Complexity Definitions
- Equipment/Line/Downtime
- Equipment/Line/Meantime
- Equipment/Line/Schedule
- Equipment/Line/Schedule/Entries
- Equipment/Line/State
- Equipment/Mode
- Equipment/State
- Equipment/Meantime
- Delta Time Stamp
- From Time Stamp
- Shift
- Shift Day Text
- Shift Day of Month
- Shift Day of Week
- Shift Day of Year
- Shift ISO Week of Year
- Shift Month Text
- Shift Month of Year
- Shift Start Date
- Shift Start Date Time
- Shift Week of Month
- Shift Week of Year
- Shift Year
- To Time Stamp
- Month Of Year
- Top of Month
- Top of Day
- Thirty Minute Interval
- Top of Hour Interval
- Hour Interval
- Top of Minute Interval
- Minute Interval
- Configurable Interval
- Elapsed Time
- OEE
- Theoretical OEE
- OEE General Count
- OEE Infeed Count
- OEE Infeed Count Equipment Path
- OEE Outfeed Count
- OEE Outfeed Count Equipment Path
- OEE Theoretical Outfeed Standard Count
- OEE Reject Count
- Outfeed Standard Count
- Planned Downtime
- Runtime
- Short Stop Time
- Standard Rate
- Standard Rate for Hour
- Target Changeover Time
- Unplanned Downtime
- OEE/Availability
- OEE/Performance
- OEE/Quality
- Active Recipe Name
- Active Recipe UUID
- Recipe Enabled
- Recipe Scale
- Recipe Tracking UUID
- Recipe Tracking UUID Sequence
- Recipe Type Code
- Recipe Type Name
- Active Recipe Time Stamp
- Recipe Variance Time Stamp
- Recipe From Value
- Recipe Set Point Description
- Recipe Set Point Name
- Recipe Set Point UUID
- Recipe Set Point Units
- Recipe Set Point Value
- Recipe To Value
- Sample Coming Due
- Sample Due
- Sample Overdue
- Sample Waiting Approval
- Signal Out of Control
- Sample Value Max
- Sample Value Min
- Sample Value Mean
- Sample Value Median
- Sample Value Standard Deviation
- Sample Name
- Any Time Interval
- Scripting with Setting Values
- Collapse Empty SPC Rows
- Constrain Line State Duration to Row
- Constrain Mode Duration to Row
- Constrain State Duration to Row
- Filter Comparison Date Format
- Enable Totalized Mode
- Include Future
- Last Values
- OEE Availability Cap
- OEE Performance Cap
- OEE Quality Cap
- Rollup Time Span
- Suppress Grouping Messages
- Row Limit
- Descending Order
- Include Children
- Unknown State as Unplanned Downtime
- Historical Cache Key
- Cache Expiration
To set up drilldown, see: Setting Up Analysis Drilldown Functionality.
Access from the Perspective Component Palette > Production >MES Analysis Selector.
Properties
Properties are set through the Perspective Property Editor in Designer or through scripting.
Note that the section prefix is included before the property name (props, position, custom or meta).
Example
Python |
self.getSibling("mesAnalysisSelector").drillDown(event.compareBy, event.filter) |
| Name | Scripting | Property Type | Description |
|---|---|---|---|
| Data | data | Dataset | Dataset that contain the analysis results. |
| Drill Down Bread Crumb | drillDownBreadCrumb | String | A string representing the drill down path. |
| Drill Down Options | drillDownOptions | Dataset | Dataset containing drill down options. |
| End Date | endDate | DateTime | End Date to get filter values. |
| Execution Time (ms) | executionTime | Long | Analysis execution time in milliseconds. |
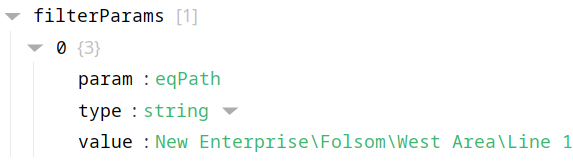
| Filter Parameters | filterParams | User-defined values to to be used when filtering. Example:
| |
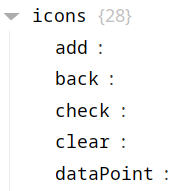
| Icons | icons | Available Icons parameters: add, back, check, clear, dataPoint, delete, detailPanel, edit, export, filter, firstPage, function, lastPage, nextPage, previousPage, radioButtonChecked, radioButtonUnchecked, refresh, resetSearch, save, search, sortArrow, thirdStateCheck, treeClosed, treeExpanded, treeFolderClosed, treeFolderOpen, viewColumn. Example:
| |
| Message | message | String | The message returned with the analysis results. |
| Previous Drill Down Enabled | previousDrillDownEnabled | Boolean | If true, then enables the previous drill down settings that can be gone back to. |
| Refresh on Settings Change | refreshOnSettingsChange | Boolean | If true, automatically refresh when analysis settings values change. |
| Show Message | showMessage | Boolean | If true, show the message returned with the analysis results. |
| Slide Panel Width | slidePanelWidth | Integer | The width of the slide panel (leave as 'null' for default size). |
| Start Date | startDate | DateTime | Start Date to get filter values. |
| Selected Analysis Name | selectedAnalysisName | String | The name of the currently-selected analysis. |
There are also numerous styling properties available:
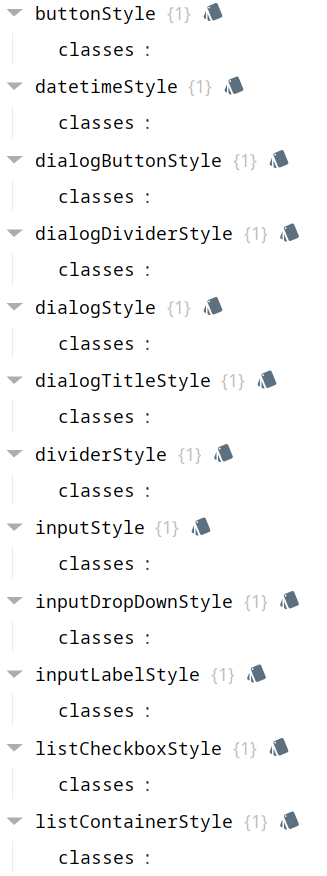
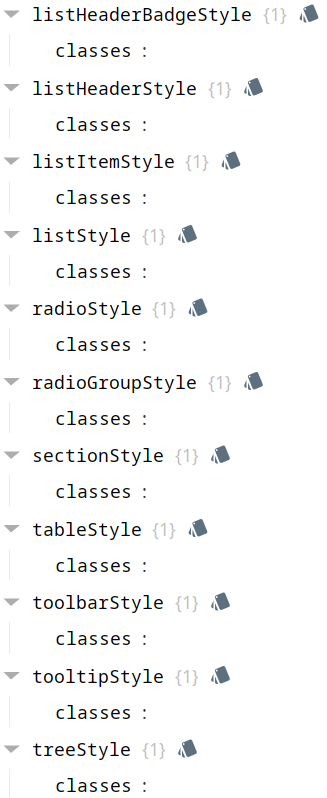
Each property above can be edited for text, background, margins and padding, border, shape, as well as opacity, cursor and overflow characteristics:
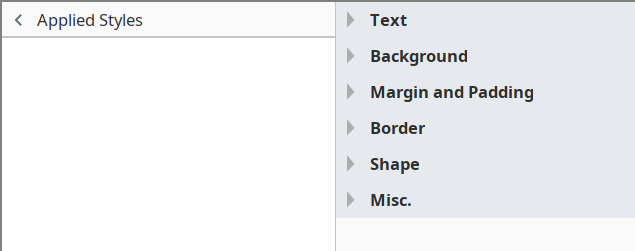
Ignition Style Editor
 | Refer to the Ignition 8 docs page Style Reference for information on modifying the properties listed below. |
| Name | Scripting |
|---|---|
| Button Style | buttonStyle |
| DateTime Style | dateTimeStyle |
| Dialog Button Style | dialogButtonStyle |
| Dialog Divider Style | dialogDividerStyle |
| Dialog Style | dialogStyle |
| Dialog Title Style | dialogTitleStyle |
| Divider Style | dividerStyle |
| Input Style | inputStyle |
| Input Drop Down Style | inputDropDownStyle |
| Input Label Style | inputLabelStyle |
| List Checkbox Style | listCheckboxStyle |
| List Container Style | listContainerStyle |
| List Header Badge Style | listHeaderBadgeStyle |
| List Header Style | listHeaderStyle |
| List Item Style | listItemStyle |
| List Style | listStyle |
| Radio Style | radioStyle |
| Radio Group Style | radioGroupStyle |
| Section Style | sectionStyle |
| Table Style | tableStyle |
| Toolbar Style | toolbarStyle |
| Tooltip Style | tooltipStyle |
| Tree Style | treeStyle |
Add Analysis Setting
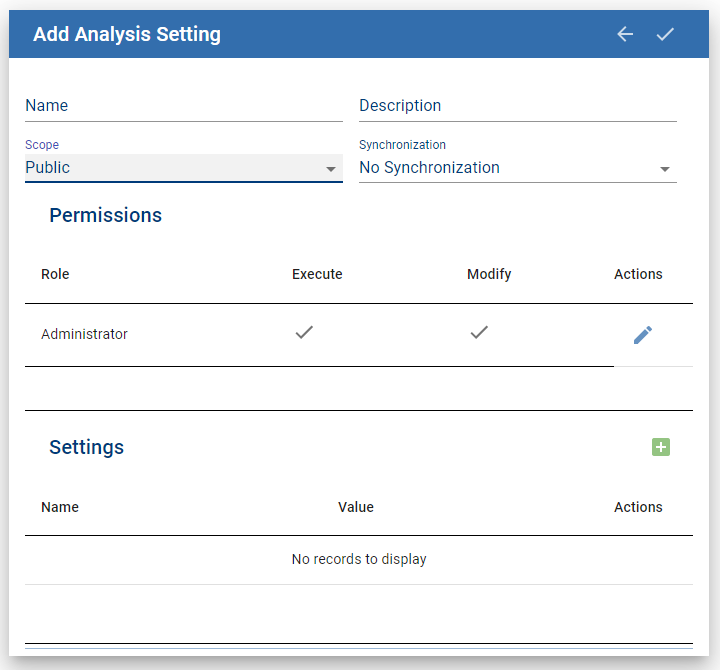
Name: Add a unique name.
Description: Optional description
Scope: Public or Private
Synchronization: Provides analysis-set(s) across enterprise gateways.
- No Synchronization
- Child Gateways Only
- Parent Gateways Only
- Both Parent and Child Gateways
Permissions: Execute and Modify permissions available for Roles.
Settings:
- Filter
- Comparison
- Date Format
- Descending Order
- Enable Totalized Mode
- Include Children
- Include Future
- Last Values
- OEE Availability Cap
- OEE Performance Cap
- OEE Quality Cap
- Rollup Time Span
- Row Limit
- Suppress Grouping Messages
- Unknown State as Unplanned Downtime
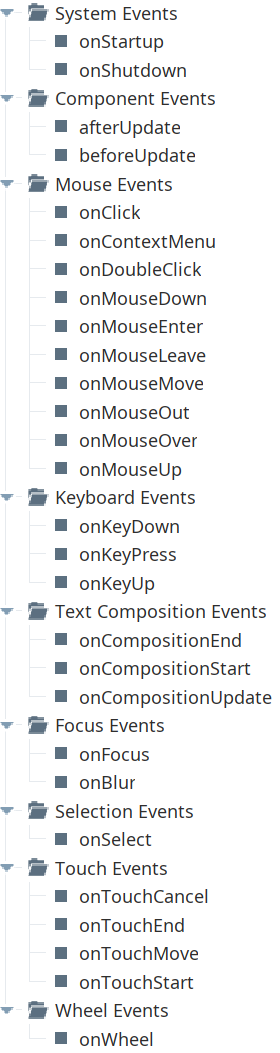
Event Handlers
Event handlers provide the ability to add custom script when a user interacts with a component.
Refer to the Ignition User Manual for details on using the available event handlers:
- Ignition: Component Events and Actions
- Ignition: Perspective Event Types Reference
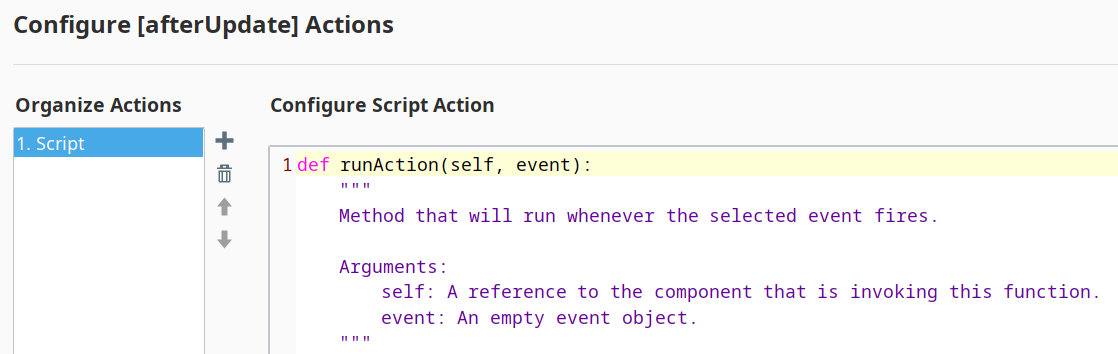
afterUpdate
- Description
Called just after analysis data is refreshed.
- Parameters
self - A reference to the component that is invoking this function.
data - The dataset that contains the new analysis data.
- Return
Nothing
- Scope
Client
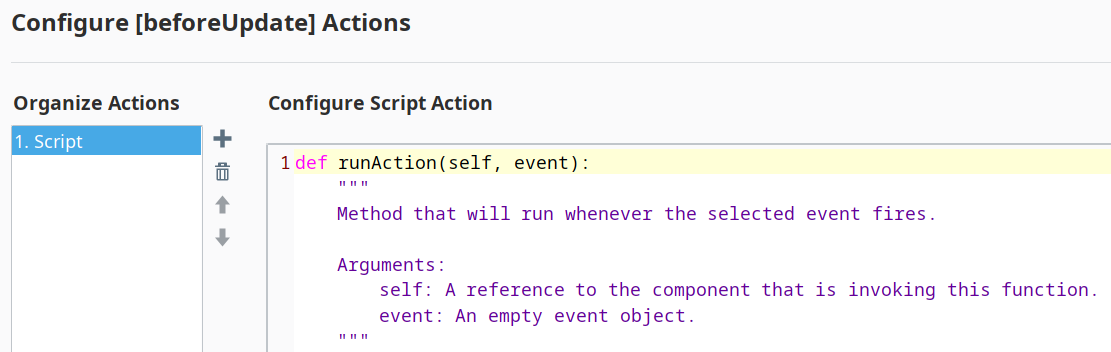
beforeUpdate
- Description
Called just before analysis data is refreshed.
- Parameters
self - A reference to the component that is invoking this function.
- Return
Nothing
- Scope
Client
Component Functions
This component provide the following functions that can be called on it. If this component has been dropped onto root of a View, then the path and an example call would be self.getSibling('mesAnalysisSelector').clearDrillDownHistory().
clearDrillDownHistory()
- Description
Removes the drill down history.
- Parameters
None
- Return
Nothing
- Scope
Client
drillDown(compareByName, filterValue)
- Description
Sets all the analysis selections to new state dictated by the drill down definition.
- Parameters
String compareByName - The compareBy definition to base the drill down.
String filtervalue - The value for filtering the analysis selections.
- Return
Nothing
- Scope
Client
prevDrillDown
- Description
Sets all the analysis selections to the previous state before the last drill down.
- Parameters
None
- Return
Nothing
- Scope
Client
executeAnalysis()
- Description
Causes analysis results to update with current result.
- Parameters
None
- Return
Nothing
- Scope
Client
Data Points and Settings
Analysis Data Points and Settings
Analysis Data Points and Settings are used by Live Analysis, the MES Analysis Selector and MES Analysis Controller components, the MES Analysis Data Source for reporting and the MES Analysis Settings object.
- Properties
- Add Analysis Setting
- Event Handlers
- Component Functions
- Data Point Column Character Limit
- Equipment Data Points
- Equipment Cell Order
- Equipment Name
- Equipment Note
- Equipment Operation Begin
- Equipment Operation End
- Equipment Operation Original Begin
- Equipment Operation Original End
- Equipment Operation Scheduled Begin
- Equipment Operation Scheduled End
- Equipment Operation Sequence
- Equipment Path
- Equipment Type
- Execution Time (ms)
- Infeed Units
- Is Key Cell
- Operation UUID
- Outfeed Units
- Product Code
- Rate Period
- Reject Units
- Work Order
- Equipment Additional Factors
- TimeStamp
- Min
- Max
- Median
- Mean
- Standard Deviation
- TimeStamp
- Equipment Count Data Points
- Equipment/Count
- Equipment Infeed Scale
- Equipment Package Count
- Equipment Reject Scale
- Counter Name - Counter Kind
- Equipment Cycle Time Data Points
- Equipment/Cycle Time
- Equipment/Cycle Time/Normal
- Equipment/Cycle Time/Overall
- Equipment/Cycle Time/Precise
- Calculation Complexity Definitions
- Line Data Points
- Equipment/Line/Downtime
- Equipment/Line/Meantime
- Equipment/Line/Schedule
- Equipment/Line/Schedule/Entries
- Equipment/Line/State
- Equipment Mode & State Data Points
- Equipment/Mode
- Equipment/State
- Meantime Data Points
- Equipment/Meantime
- General Data Points
- Delta Time Stamp
- From Time Stamp
- Shift
- Shift Day Text
- Shift Day of Month
- Shift Day of Week
- Shift Day of Year
- Shift ISO Week of Year
- Shift Month Text
- Shift Month of Year
- Shift Start Date
- Shift Start Date Time
- Shift Week of Month
- Shift Week of Year
- Shift Year
- To Time Stamp
- Month Of Year
- Top of Month
- Top of Day
- Thirty Minute Interval
- Top of Hour Interval
- Hour Interval
- Top of Minute Interval
- Minute Interval
- Configurable Interval
- Batch Procedure Data Points
- Elapsed Time
- OEE
- Theoretical OEE
- OEE General Count
- OEE Infeed Count
- OEE Infeed Count Equipment Path
- OEE Outfeed Count
- OEE Outfeed Count Equipment Path
- OEE Theoretical Outfeed Standard Count
- OEE Reject Count
- Outfeed Standard Count
- Planned Downtime
- Runtime
- Short Stop Time
- Standard Rate
- Standard Rate for Hour
- Target Changeover Time
- Unplanned Downtime
- OEE/Availability
- OEE/Performance
- OEE/Quality
- Settings & Changeover Data Points
- Active Recipe Name
- Active Recipe UUID
- Recipe Enabled
- Recipe Scale
- Recipe Tracking UUID
- Recipe Tracking UUID Sequence
- Recipe Type Code
- Recipe Type Name
- Active Recipe Time Stamp
- Recipe Variance Time Stamp
- Recipe From Value
- Recipe Set Point Description
- Recipe Set Point Name
- Recipe Set Point UUID
- Recipe Set Point Units
- Recipe Set Point Value
- Recipe To Value
- SPC Data Points
- Sample Coming Due
- Sample Due
- Sample Overdue
- Sample Waiting Approval
- Signal Out of Control
- Sample Value Max
- Sample Value Min
- Sample Value Mean
- Sample Value Median
- Sample Value Standard Deviation
- Sample Name
- Any Time Interval
- Setting Values
- Scripting with Setting Values
- Historical Cache Key
- Collapse Empty SPC Rows
- Constrain Line State Duration to Row
- Constrain Mode Duration to Row
- Constrain State Duration to Row
- Filter Comparison Date Format
- Enable Totalized Mode
- Include Future
- Last Values
- OEE Availability Cap
- OEE Performance Cap
- OEE Quality Cap
- Rollup Time Span
- Suppress Grouping Messages
- Row Limit
- Descending Order
- Include Children
- Unknown State as Unplanned Downtime
- Historical Cache Key
- Cache Expiration
Data Point Column Character Limit

|
Data points column character limit is the max limit allowed by the database being used. Minimum value is 4,000.
|
Equipment Data Points
| Data Point | Description | Units |
|---|---|---|
Equipment Cell Order |
Int4 - Integer value that determines the cell order of the equipment within the line. The key cell is always order 0. This means that the index shifts based on where the key cell is. | N/A |
Equipment Name |
String - Name of the equipment as defined in the production model. | N/A |
Equipment Note |
String - Any note that has been recorded for this piece of equipment through the Note tag collector path in the Production model will be exposed here. | N/A |
Equipment Operation Begin |
Start Date Time of the currently running operation on this equipment. | N/A |
Equipment Operation End |
DateTime - End DateTime of the last operation that ran on this equipment. | N/A |
Equipment Operation Original Begin |
DateTime - The original user-set begin DateTime for the operation on this equipment. This value does not change if the operation schedule changes. | N/A |
Equipment Operation Original End |
DateTime - The original user-set end DateTime for the operation on this equipment. This value does not change if the operation schedule changes. | N/A |
Equipment Operation Scheduled Begin |
DateTime - The current system-set begin DateTime for the operation on this equipment. Value will remain as null if the operation was not created via a schedule. | N/A |
Equipment Operation Scheduled End |
DateTime - The current system-set end DateTime for the operation on this equipment. Value will remain as null if the operation was not created via a schedule. | N/A |
Equipment Operation Sequence |
Int4 - The ordinal number (integer) of operation. | N/A |
Equipment Path |
String - Production model path for this equipment. | N/A |
Equipment Type |
String - Can be Line, Cell Group or Cell. | N/A |
Execution Time (ms) |
Int8 - Time taken to execute and update the Live Analysis. Used mainly for performance debugging. | milliseconds |
Infeed Units |
String - See OEE Material Production Settings > Infeed Units for more details. | This could be Cans, Bottles, etc. |
Is Key Cell |
Boolean - See OEE Material Production Settings > Key Reason for more details. | N/A |
Operation UUID |
String - Unique Identifier for currently running operation. | N/A |
Outfeed Units |
String - See OEE Material Production Settings > Outfeed Units for more details. | This could be Cans, Bottles, etc. |
Product Code |
String - Product code currently being processed on this equipment. | N/A |
Rate Period |
String - See OEE Material Production Settings > Rate Period for more details. | Options: Hours or Minutes |
Reject Units |
String - See OEE Material Production Settings > Reject Units for more details. | This could be Cans, Bottles, etc. |
Work Order |
String - Work order currently being processed on this equipment. | N/A |
Equipment Additional Factors
| Data Point | Data Type | Description | Units |
|---|---|---|---|
|
<additional_factor_name>.TimeStamp TimeStamp
|
String |
When a string data type tag is used to create a new, user-defined Additional Factor, one additional data point will automatically be created and maintained for each:
|
N/A |
|
<additional_factor_name>.Min
MinMaxMedianMeanStandard DeviationTimeStamp |
Int1, Int2, Int4, Int8, Float4, Float8 |
When tags of the numeric data types listed to the left are used to create a new, user-defined Additional Factor, six additional data points will automatically be created and maintained for each (calculations are performed using all of the resulting values from that analysis run):
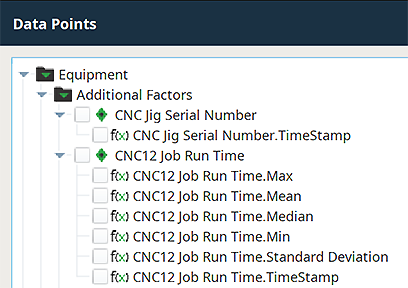
|
N/A |
Equipment Count Data Points
| Data Point | Data Type | Description | Units | ||
|---|---|---|---|---|---|
Equipment/Count
Any defined counters for the production item will also appear in this folder.
Equipment Infeed Scale
Float8
See OEE Material Production Settings > Infeed Units for more details.
Equipment Package Count
Float8
See OEE Material Production Settings > Package Count for more details.
Equipment Reject Scale
Float8
See OEE Material Production Settings > Reject Count Scale for more details.
Counter Name - Counter Kind
<counter_kind>-<counter_name>
Integer
There is one Data Point generated for each MES Counter created in the Production Model (Counters section of the MES Equipment Manager under General). Each is named as the Counter Kind (ex: General, Infeed, Outfeed or Reject), followed by a dash and then the Counter Name provided. Example: Outfeed-Material Out.
The hover tooltip seen in the MES Analysis Selector component is the text in the Counter Description field for the counter.
Equipment Cycle Time Data Points
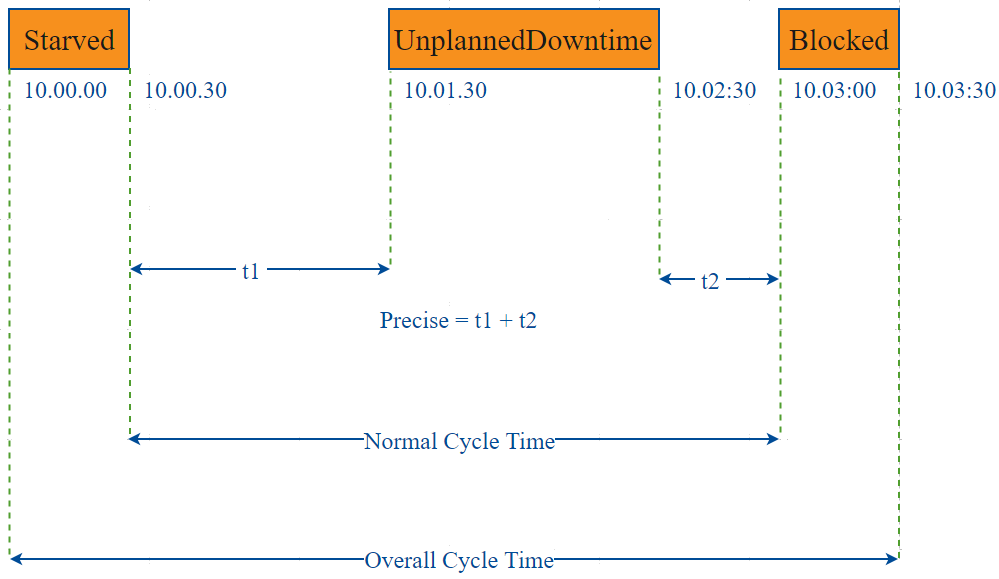
The Cycle Time data points provide a number of metrics that can be used to measure the amount of time required to produce one piece. It is often used to gain an understanding of variations in production. The Cycle Time calculations are based on the Cycle Count value provided to the system. Analysis provides Target, Normal, Overall, and Precise Cycle Time metrics. The Analysis Engine assumes valid data for this calculation. Invalid data, such as Unknown States, disrupt the calculation. Details of the calculations are described below.
| Included in Analysis | Not Included in Analysis |
|
States Analyzed Per Cycle Metric |
|||||||
|---|---|---|---|---|---|---|---|
|
Cycle Time Metric |
Running |
Unplanned Downtime |
Planned Downtime |
Starved |
Blocked |
Idle |
Disabled |
|
Overall Cycle Time |
|
|
|
|
|
|
|
|
Normal Cycle Time |
|
|
|
|
|
|
|
|
Precise Cycle Time |
|
|
|
|
|
|
|
| Data Point | Data Type | Description | Units | ||
|---|---|---|---|---|---|
Equipment/Cycle Time |
|||||
|
Relative Cycle Count |
String |
Relative Cycle Count is the change in cycle count that occurred during an analysis row.
|
N/A | ||
|
Target Cycle Time |
Float8 | Also known as Takt time, it is how often a piece must be produced to meet customer demand. It is often used to pace a production line, and it is a calculated number in minutes. This is defined a 1/Standard Rate. | minutes | ||
Total Cycle Count
|
String |
Total Cycle Count is cumulative and represents the total change in cycle count since the beginning of the analysis period.
|
N/A | ||
Equipment/Cycle Time/Normal |
Normal Cycle Time calculations include Running and Unplanned Downtime states and ignore all other states like Starved, Blocked, Planned Downtime etc. normalCycleTime = analysisRowTime - (disabledTime + blockedTime + starvedTime) |
||||
|
Average Normal Cycle Time |
Float8 | Average Normal cycle time in minutes.
averageNormalCycleTime = normalCycleTime / numberOfCompletedCycles |
minutes | ||
|
Max Normal Cycle Time |
Float8 | Max Normal cycle time in minutes.
Look at each of the cycles time periods, subtract any time the equipment was in a disabled, idle, planned downtime, blocked, or starved state, then select the largest value. |
minutes
|
||
|
Min Normal Cycle Time |
Float8 | Min Normal cycle time in minutes.
Look at each of the cycles time periods, subtract any time the equipment was in a disabled, idle, planned downtime, blocked, or starved state, then select the smallest value. |
minutes
|
||
|
Normal Cycle Time |
Float8 | Time spent cycling that includes Running and Unplanned Downtime states and ignores all other equipment states. normalCycleTime = analysisRowTime - (disabledTime + blockedTime + starvedTime) |
minutes
|
||
Equipment/Cycle Time/Overall |
Overall Cycle Time calculations include all equipment states except Disabled. | ||||
|
Average Overall Cycle Time |
Float8 | Average Overall cycle time in minutes.
averageOverallCycleTime = overallCycleTime / numberOfCompletedCycles |
minutes
|
||
|
Max Overall Cycle Time |
Float8 | Max Overall cycle time in minutes.
Look at each of the cycles time periods, subtract any time the equipment was in a disabled state, then select the largest value |
minutes
|
||
|
Min Overall Cycle Time |
Float8 | Min Overall cycle time in minutes.
Look at each of the cycles time periods, subtract any time the equipment was in a disabled state, then select the smallest value |
minutes
|
||
|
Overall Cycle Time |
Float8 | Time spent cycling that includes all equipment states except Disabled. overallCycleTime = analysisRowTime - disabledTime |
minutes
|
||
Equipment/Cycle Time/Precise |
Precise Cycle Time calculations only include equipment Running states. | ||||
|
Average Precise Cycle Time |
Float8 | Average Precise cycle time in minutes.
averagePreciseCycleTime = preciseCycleTime / numberOfCompletedCycles |
minutes
|
||
|
Max Precise Cycle Time |
Float8 | Max Precise cycle time in minutes.
Look at each of the cycles time periods, subtract any time the equipment was not in a running state, then select the largest value. |
minutes
|
||
|
Min Precise Cycle Time |
Float8 | Min Precise cycle time in minutes.
Look at each of the cycles time periods, subtract any time the equipment was not in a running state, then select the smallest value. |
minutes
|
||
|
Precise Cycle Time |
Float8 | Time spent cycling that only includes equipment Running states. preciseCycleTime=analysisTime-(anyTimeNotRunning) |
minutes
|
||
Example
The diagram below represents an analysis sample looking at a scope of 50 minutes. Each sample varies in complexity of calculation of cycle time and counts.
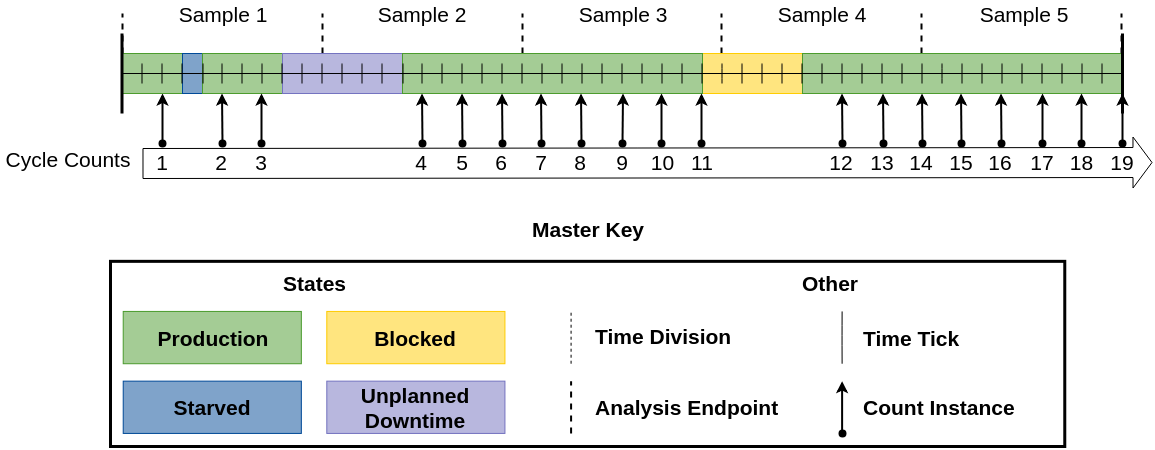
Important Things to Note
Each Time Tick represents 1 minute.
The scope of each Analysis Row (delimited by Analysis Endpoints) is 10 minutes.
Each part takes 2 minutes of Production Time to make.
Minimum, Maximum, and Average Cycle Time calculations only look at the completed (whole) cycles within the analysis rows. Cycle times can span previous rows. Example: If an Analysis result set spans from 3:00PM to 5:00PM, but the first increment to the Cycle Count occurs at 3:05PM, then that initial 5 minutes is not included when calculating the Min, Max or Average data points for Cycles. Likewise, any incomplete cycles at the end of the date range will also not be included in the calculations.
Calculation Complexity Definitions | |
|---|---|
Complexity | Description |
Low | Very simple to calculate all different cycle times. (Overall, Normal, and Precise the same) |
Medium | A little more difficult to calculate different cycle times. (At least 2 types have different results.) May have cycles extending past the analysis scope. |
High | The most difficult to calculate different cycle times. (All types have different results.) Has cycles extending past the analysis scope. |
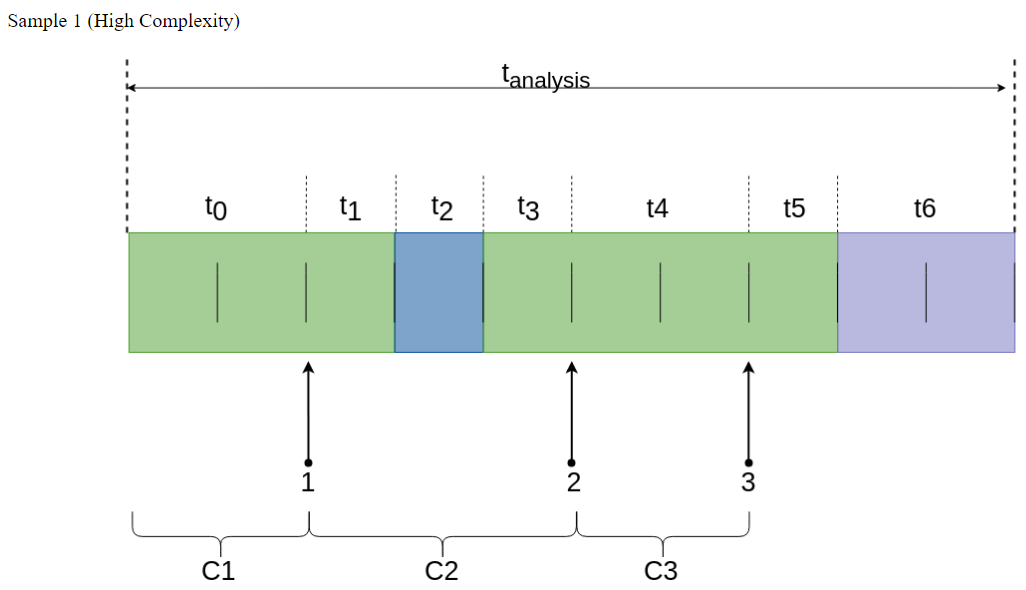
Sample 1 (High Complexity) | ||
Cycle Time Length | ||
|---|---|---|
Type | Time Calculation | Value |
Overall Cycle Time | tanalysis | 10 minutes |
Normal Cycle Time | tanalysis - t2 | 9 minutes |
Precise Cycle Time | tanalysis - (t2 + t6) | 7 minutes |
Min Cycle Time | ||
Type | Cycle Time Calculation | Min Cycle Time (mins) |
Min Overall Cycle Time | C1overall: t0 = 2 mins C2overall: t1+t2+t3 = 3 mins C3overall: t4 = 2 mins | 2 minutes |
Min Normal Cycle Time | C1normal: t0 = 2 mins C2normal: t1+t3 = 2 mins C3normal: t4 = 2 mins | 2 minutes |
Min Precise Cycle Time | C1precise: t0 = 2 mins C2precise: t1+t3 = 2 mins C3precise: t4 = 2 mins | 2 minutes |
Max Cycle Time | ||
Type | Cycle Time Calculation | Max Cycle Time (mins) |
Max Overall Cycle Time | Same as Min Cycle Time | 3 minutes |
Max Normal Cycle Time | Same as Min Cycle Time | 2 minutes |
Max Precise Cycle Time | Same as Min Cycle Time | 2 minutes |
Average Cycle Time | ||
Type | Avg Time Calculation | Avg Value |
Average Overall Cycle Time | (C1overall + C2overall + C3overall) / 3 cycles (2 mins + 3 mins +2 mins) / 3 cycles | 2.33 minutes |
Average Normal Cycle Time | (C1normal + C2normal + C3normal) / 3 cycles (2 mins + 2 mins + 2 mins) / 3 cycles | 2.00 minutes |
Average Precise Cycle Time | (C1precise + C2precise + C3precise) / 3 cycles (2 mins + 2 mins + 2 mins) / 3 cycles | 2.00 minutes |
Sample 2 (Medium Complexity) | ||
Type | Time Calculation | Value |
Overall Cycle Time | tanalysis | 10 minutes |
Normal Cycle Time | tanalysis | 10 minutes |
Precise Cycle Time | tanalysis - t9 | 6 minutes |
Min Cycle Time | ||
|---|---|---|
Type | Cycle Time Calculation | Min Cycle Time (mins) |
Min Overall Cycle Time | C4overall: t7+t8+t9+t10 = 8 mins C5overall: t11 = 2 mins C6overall: t12 = 2 mins | 2 minutes |
Min Normal Cycle Time | C4normal: t7+t8+t9+t10 = 8 mins C5normal: t11 = 2 mins C6normal: t12 = 2 mins | 2 minutes |
Min Precise Cycle Time | C4precise: t7+t10 = 2 mins C5precise: t11 = 2 mins C6precise: t12 = 2 mins | 2 minutes |
Max Cycle Time | ||
Type | Cycle Time Calculation | Max Cycle Time (mins) |
Max Overall Cycle Time | Same as Min Cycle Time | 8 minutes |
Max Normal Cycle Time | Same as Min Cycle Time | 8 minutes |
Max Precise Cycle Time | Same as Min Cycle Time | 2 minutes |
Average Cycle Time | ||
Type | Avg Time Calculation | Avg Value |
Average Overall Cycle Time | (C4overall + C5overall + C6overall) / 3 cycles (8 mins + 2 mins +2 mins) / 3 cycles | 4.00 minutes |
Average Normal Cycle Time | (C4normal + C5normal + C6normal) / 3 cycles (8 mins + 2 mins + 2 mins) / 3 cycles | 4.00 minutes |
Average Precise Cycle Time | (C4precise + C5precise + C6precise) / 3 cycles (2 mins + 2 mins + 2 mins) / 3 cycles | 2.00 minutes |
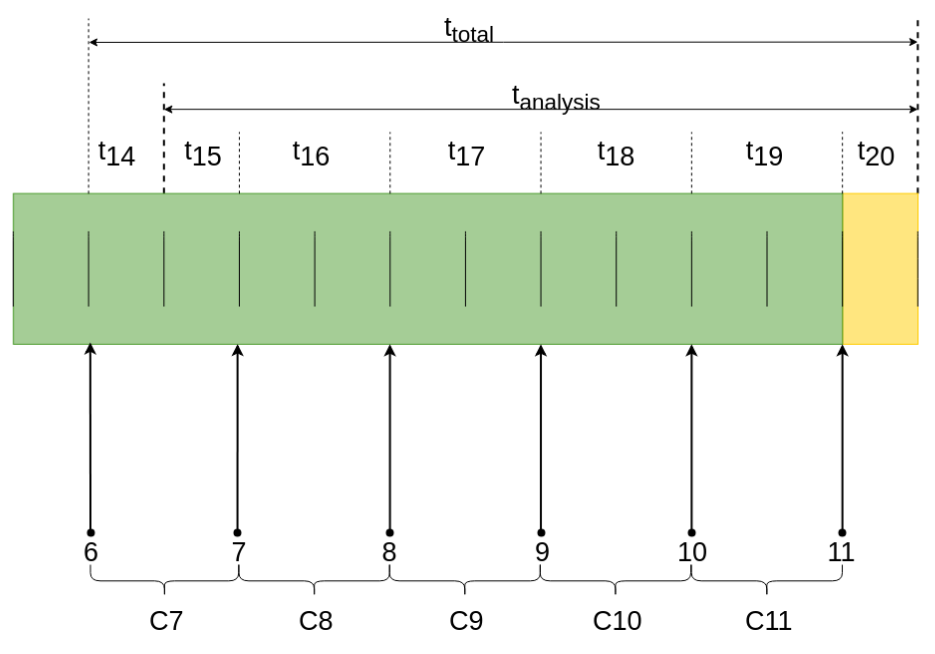
Sample 3 (Medium Complexity)
Sample 3 (Medium Complexity
Cycle Time Length | ||
|---|---|---|
Type | Time Calculation | Value |
Overall Cycle Time | tanalysis | 10 minutes |
Normal Cycle Time | tanalysis - t20 | 9 minutes |
Precise Cycle Time | tanalysis - t20 | 9 minutes |
Min Cycle Time | ||
Type | Cycle Time Calculation | Min Cycle Time (mins) |
Min Overall Cycle Time | C7overall: t14+t15 = 2 mins C8overall: t16 = 2 mins C9overall: t17 = 2 mins C10overall: t18 = 2 mins C11overall: t19 = 2 mins | 2 minutes |
Min Normal Cycle Time | C7normal: t14+t15 = 2 mins C8normal: t16 = 2 mins C9normal: t17 = 2 mins C10normal: t18 = 2 mins C11normal: t19 = 2 mins | 2 minutes |
Min Precise Cycle Time | C7precise: t14+t15 = 2 mins C8precise: t16 = 2 mins C9precise: t17 = 2 mins C10precise: t18 = 2 mins C11precise: t19 = 2 mins | 2 minutes |
Max Cycle Time | ||
Type | Cycle Time Calculation | Max Cycle Time (mins) |
Max Overall Cycle Time | Same as Min Cycle Time | 2 minutes |
Max Normal Cycle Time | Same as Min Cycle Time | 2 minutes |
Max Precise Cycle Time | Same as Min Cycle Time | 2 minutes |
Average Cycle Time | ||
Type | Avg Time Calculation | Avg Value |
Average Overall Cycle Time | (C7overall + C8overall + C9overall + C10overall + C11overall)/ 5 cycles (2 mins + 2 mins + 2 mins + 2 mins +2 mins) / 5 cycles | 2.00 minutes |
Average Normal Cycle Time | (C7normal + C8normal + C9normal + C10normal + C11normal)/ 5 cycles (2 mins + 2 mins + 2 mins + 2 mins +2 mins) / 5 cycles | 2.00 minutes |
Average Precise Cycle Time | (C7precise + C8precise + C9precise + C10precise + C11precise)/ 5 cycles (2 mins + 2 mins + 2 mins + 2 mins +2 mins) / 5 cycles | 2.00 minutes |
Sample 4 (Medium Complexity)
Cycle Time Length | ||
|---|---|---|
Type | Time Calculation | Value |
Overall Cycle Time | tanalysis | 10 minutes |
Normal Cycle Time | tanalysis - t22 | 6 minutes |
Precise Cycle Time | tanalysis - t22 | 6 minutes |
Min Cycle Time | ||
Type | Cycle Time Calculation | Min Cycle Time (mins) |
Min Overall Cycle Time | C12overall: t21+t22+t23 = 7 mins C13overall: t24 = 2 mins C14overall: t25 = 2 mins | 2 minutes |
Min Normal Cycle Time | C12normal: t23 = 2 mins C13normal: t24 = 2 mins C14normal: t25 = 2 mins | 2 minutes |
Min Precise Cycle Time | C12precise: t23 = 2 mins C13precise: t24 = 2 mins C14precise: t25 = 2 mins | 2 minutes |
Max Cycle Time | ||
Type | Cycle Time Calculation | Min Cycle Time (mins) |
Max Overall Cycle Time | Same as Min Cycle Time | 7 minutes |
Max Normal Cycle Time | Same as Min Cycle Time | 2 minutes |
Max Precise Cycle Time | Same as Min Cycle Time | 2 minutes |
Average Cycle Time | ||
Type | Avg Time Calculation | Avg Value |
Average Overall Cycle Time | (C12overall + C13overall + C14overall)/ 3 cycles (7 mins + 2 mins + 2 mins) / 3 cycles | 3.67 minutes |
Average Normal Cycle Time | (C12normal + C13normal + C14normal)/ 3 cycles (2 mins + 2 mins + 2 mins) / 3 cycles | 2.00 minutes |
Average Precise Cycle Time | (C12precise + C13precise + C14precise)/ 3 cycles (2 mins + 2 mins + 2 mins) / 3 cycles | 2.00 minutes |
Cycle Time Length | ||
|---|---|---|
Type | Time Calculation | Value |
Overall Cycle Time | tanalysis | 10 minutes |
Normal Cycle Time | tanalysis | 10 minutes |
Precise Cycle Time | tanalysis | 10 minutes |
Min Cycle Time | ||
Type | Cycle Time Calculation | Min Cycle Time (mins) |
Min Overall Cycle Time | C15overall: t26 = 2 mins C16overall: t27 = 2 mins C17overall: t28 = 2 mins C18overall: t29 = 2 mins C19overall: t30 = 2 mins | 2 minutes |
Min Normal Cycle Time | C15normal: t26 = 2 mins C16normal: t27 = 2 mins C17normal: t28 = 2 mins C18normal: t29 = 2 mins C19normal: t30 = 2 mins | 2 minutes |
Min Precise Cycle Time | C15precise: t26 = 2 mins C16precise: t27 = 2 mins C17precise: t28 = 2 mins C18precise: t29 = 2 mins C19precise: t30 = 2 mins | 2 minutes |
Max Cycle Time | ||
Type | Cycle Time Calculation | Min Cycle Time (mins) |
Max Overall Cycle Time | Same as Min Cycle Time | 2 minutes |
Max Normal Cycle Time | Same as Min Cycle Time | 2 minutes |
Max Precise Cycle Time | Same as Min Cycle Time | 2 minutes |
Type | Avg Time Calculation | Avg Value |
Average Overall Cycle Time | (C15overall + C16overall + C17overall + C18overall + C19overall)/ 5 cycles (2 mins + 2 mins + 2 mins + 2 mins +2 mins) / 5 cycles | 2.00 minutes |
Average Normal Cycle Time | (C15normal + C16normal + C17normal + C18normal + C19normal)/ 5 cycles (2 mins + 2 mins + 2 mins + 2 mins +2 mins) / 5 cycles | 2.00 minutes |
Average Precise Cycle Time | (C15precise + C16precise + C17precise + C18precise + C19precise)/ 5 cycles (2 mins + 2 mins + 2 mins + 2 mins +2 mins) / 5 cycles | 2.00 minutes |
Line Data Points
The Line Data points returns data for the line regardless of the Equipment the Live Analysis has been set up for.
| Data Point | Data Type | Description | Units | ||
|---|---|---|---|---|---|
Equipment/Line/Downtime |
|||||
| Line Downtime Can Revert Split | Boolean | True if the line downtime reason split can be reverted. | N/A | ||
| Line Downtime End State Time Stamp | Date-Time | When down time events are rolled up, this is the time stamp of the last event. | N/A | ||
|
Line Downtime Equipment Name |
String | Name of the equipment that is responsible for causing line downtime. | N/A | ||
|
Line Downtime Equipment Path |
String | Production model equipment path for equipment that is responsible for causing line downtime. | N/A | ||
|
Line Downtime Event Sequence |
Int4 | Every downtime event on the line is provided with an incrementing sequence number. | N/A | ||
|
Line Downtime Occurrence Count |
Int4 | Number of downtime events for the selected period. | N/A | ||
| Line Downtime Original Equipment Path | String | The original path of the equipment that caused the line downtime before being reassigned to differed equipment. | N/A | ||
| Line Downtime Original Reason | String | The line or cell group (sub line) original downtime reason. | N/A | ||
| Line Downtime Original Reason Code | Int4 | The line or cell group (sub line) original downtime reason code. | N/A | ||
|
Line Downtime Reason |
String |
The line or cell group (sub line) downtime reason.
|
N/A | ||
|
Line Downtime Reason Path |
String | The reason name for line or cell group (sub line) downtime reasons, including Equipment State Class and any reasons above the selected reason in the state tree. E.g. Default Class/Unplanned Downtime/Mechanical Faults/Chain Slip. | N/A | ||
|
Line Downtime Reason Split |
Boolean | The line downtime reason split indicator. True is current downtime event has been split into multiple downtime events. | N/A | ||
|
Line Downtime State Time Stamp |
DateTime | The time stamp for the equipment state change of the cell group (sub line) or cell that caused the line downtime events. | N/A | ||
Equipment/Line/Meantime |
|||||
| Line MTBF | Float8 |
The calculated Meantime (minutes) Between Failure for the line (or subline) in the selected period and does take into account the downtime detection method. Refer to Configuring Equipment States > Meantime Metrics. |
minutes | ||
| Line Meantime Metrics Enabled | Boolean | Returns true if the current line (or subline) state is enabled for meantime metrics. | N/A | ||
Equipment/Line/Schedule |
|||||
|
Line Schedule Available |
Boolean | Determined by Ignition Shift schedule. True if data returned is within a configured shift for the equipment. | N/A | ||
|
Line Schedule Available Time |
Float8 | Time in minutes for available production time adjusted for line schedule availability and mode. "Line Schedule Available Time" is not applicable to cells or cell groups. | minutes | ||
|
Line Standard Count |
String |
Amount of product that should have been produced based on the line schedule available time and line standard rate. The available time is determined from the Ignition schedules that are selected for the line. If Ignition schedules are not selected for the line, then the scheduled count will be used. Actual line downtime is not used for this calculation. See OEE Material Production Settings > standard rate |
N/A | ||
| Line Schedule Count | Double | Scheduled count of a machine. | N/A | ||
| Line Schedule Duration | Double | Scheduled duration of a machine. | minutes | ||
|
Line Standard Count Variance |
String | Variance between line standard count and line OEE outfeed count.
OEE Outfeed Count - Line Standard Count
|
N/A | ||
|
Line Target Count |
String |
Amount of product that should have been produced based on the line schedule available time and line schedule rate. The available time is determined from the Ignition schedules that are selected for the line. If Ignition schedules are not selected for the line, then the scheduled count will be used. Actual line downtime is not used for this calculation.
See OEE Material Production Settings > schedule rate
|
N/A | ||
|
Line Target Count Variance |
String |
Variance between OEE Outfeed Count and Line Target Count. OEE Outfeed Count - Line Target Count
|
N/A | ||
|
Schedule Rate |
Float8 | See OEE Material Production Settings > schedule rate | production units/unit of time | ||
| Scheduled Shift | String | Scheduled shift, based on the assigned Ignition schedule. | N/A | ||
| Scheduled Shift End Date Time | Date-Time | Scheduled end date, based on the assigned Ignition schedule. | N/A | ||
| Scheduled Shift Start Date Time | Date-Time | Scheduled start date, based on the assigned Ignition schedule. | N/A | ||
Equipment/Line/Schedule/Entries |
|||||
| Calculated Scheduled Quantity | Float8 | The sum of all (request segment duration (minutes) * rate (converted to minutes)) for segments in a available time. | production units | ||
| Entry Begin Date Time | Date-Time | The begin time of the Operations Request. | N/A | ||
| Entry End Date Time | Date-Time | The end time of the Operations Request. | N/A | ||
| Entry Request Segment End Date Time | Date-Time | The End Time of Request Segments in the Operations Request. | N/A | ||
| Entry Schedule Type | String | The equipment operation schedule type, either "Held" or "Active". | N/A | ||
| Entry Scheduled Duration | Float8 | The duration of a scheduled operation in minutes (only valid if the Entry Scheduled Method is set to "Duration"). Note: Value is 0 when Entry Scheduled Method is set to "Count". | minutes | ||
| Entry Scheduled Method | String | The equipment operation scheduling method, either "Count" or "Duration". | N/A | ||
| Entry Scheduled Quantity | Int4 | The output count of a scheduled operation (only valid if the Entry Scheduled Method is set to "Count"). Note: Value is null when Entry Scheduled Method is set to "Duration". | production units | ||
| Entry Scheduled Rate | Float8 | The "Rate" from the Material Property on the Segment. Note that units are either hours or minutes based on the Entry Schedule Rate Period setting. | production units/unit of time (hours or minutes) | ||
| Entry Scheduled Rate Period | String | The "Rate Period" property from the Material Property on the Segment, either "None", "Hour", "Min", or "Cycle". | N/A | ||
| Operations Request Name | String | The Name of the Operations Request object. | N/A | ||
| Operations Request UUID | String | The UUID of the Operations Request object. | N/A | ||
Equipment/Line/State |
|||||
|
Line State Duration |
Float8 |
The line or cell group (sub line) downtime event duration in minutes. Important
|
minutes | ||
|
Line State Event Begin |
Date-Time |
The line or cell group (sub line) downtime event begin date time.
The Line State Event Begin Time and Line State Event End Time display the actual begin and end times, even if the times fall outside of the row to and from times. |
N/A | ||
|
Line State Event End |
DateTime |
The line or cell group (sub line) downtime event end date time.
The Line State Event Begin Time and Line State Event End Time display the actual begin and end times, even if the times fall outside of the row to and from times.
|
N/A | ||
|
Line State Event Sequence |
Int4 | The equipment state event sequence number. | N/A | ||
|
Line State Name |
String |
The line or cell group (sub line) state.
|
N/A | ||
| Line State Overridden | Boolean |
When Key Reason Detection is set or Cell Groups are used, overriding the State must happen at the Line level. |
N/A | ||
|
Line State Override Scope |
String | The state override scope for a line or cell group (sub line). See Setting Up Equipment - Override Scope for more details. | N/A | ||
|
Line State Override Type |
String | The state override type for a line or cell group (sub line). See Setting Up Equipment - Override for more details. | N/A | ||
|
Line State Type |
String | The line or cell group (sub line) state type. See Setting Up Equipment - State Type for more details. | N/A | ||
|
Line State Value |
Int4 | The line or cell group (sub line) downtime state code. See Setting Up Equipment - State Code for more details. | N/A | ||
Equipment Mode & State Data Points
| Data Point | Data Type | Description | Units | ||
|---|---|---|---|---|---|
Equipment/Mode |
|||||
|
Equipment Mode Name |
String | Name of the current mode. See Equipment Modes and States for more details. | N/A | ||
|
Equipment Mode Type |
String | Name of the current mode type. See Equipment Modes and States for more details. | N/A | ||
|
Equipment Mode Value |
Int4 | Name of the current mode. See Equipment Modes and States for more details. | N/A | ||
|
Mode Begin Time |
DateTime |
Start time of the current mode.
|
N/A | ||
|
Mode Duration |
Float8 | Duration of the current mode in minutes. This is calculated as Mode End Time - Mode Begin Time. | minutes | ||
| Mode End Time | DateTime |
End time of the current mode.
|
N/A | ||
| OEE Enabled | Boolean | See Setting Up Equipment Modes - OEE Enabled for more details. | N/A | ||
| Production Counts Enabled | Boolean | See Setting Up Equipment Modes - Production Counts Enabled for more details. | N/A | ||
Equipment/State |
|||||
| Equipment Original State Value | Int4 | The original value of equipment state tag collector before it is updated by using MES Value Editor component or scripting. | N/A | ||
| Equipment State Name | String |
Current state name based on tag value provided to this tag collector. Line Level Considerations
|
N/A | ||
| Equipment State Path | String | The state name and address for the given status, including Equipment State Class and any states above the selected state in the state tree. E.g. Default Class/Unplanned Downtime/Mechanical Faults/Chain Slip . | N/A | ||
| Equipment State Split | Boolean | True is current downtime event has been split into multiple downtime events. | N/A | ||
| Equipment State Type | String | See Setting Up Equipment - State Type for more details. | N/A | ||
| State Begin Time | DateTime |
Start time of the current state.
|
N/A | ||
| State Duration | Float8 | Duration of current state in minutes. This is calculated as State End Time - State Begin Time. | minutes | ||
| State End Time | DateTime |
End time of the current state.
|
N/A | ||
|
|
For Mode Begin Time and Mode End Time the times displayed will always be the actual begin and end times, even if the times fall outside of the row to and from times. |
Meantime Data Points
| Data Point | Data Type | Description | Units |
|---|---|---|---|
Equipment/Meantime |
|||
| Equipment MTBF | Float8 | The Mean Time (minutes) Between Failure for the equipment in selected period. This does take into account the downtime detection method. | minutes |
| Equipment Meantime Metrics Enabled | Boolean | True if Equipment Meantime Metrics are enabled for the current equipment state. | N/A |
General Data Points
| Data Point | Data Type | Description | Units | ||
|---|---|---|---|---|---|
| General | |||||
Delta Time Stamp |
Float8 | Time gap (minutes) between the rows of data (measured between From Time Stamp and To Time Stamp). | minutes | ||
From Time Stamp |
DateTime | Start date time of the current period (run time of the analysis). | N/A | ||
Shift |
String | Name of the current shift as set by the Ignition Schedule Management component and defined for the current line or by the value passed in the equipment shift tag collector. | N/A | ||
Shift Day Text |
String | Name of the current day. | N/A | ||
Shift Day of Month |
Int4 | Int value of the current day of the month. | N/A | ||
Shift Day of Week |
Int4 | Int value of the current day of the week. | N/A | ||
Shift Day of Year |
Int4 | Int value of the current day of the year. | N/A | ||
Shift ISO Week of Year |
Int4 | Int value of the ISO week of the year. | N/A | ||
Shift Month Text |
String | Name of the current month. | N/A | ||
Shift Month of Year |
Int4 | Int value of the current month of the year. Months are numbered 0-11. (i.e January: 0, February: 1, ..., December: 11) | N/A | ||
Shift Start Date |
DateTime |
Calendar start date of the shift. Since this is a Java DateTime object, it will show midnight as the time. Only the date is accurate. Example 1: If a shift starts at 10PM on Day 1 and continues to 6AM on Day 2, then the Shift Start Date will be set to Day 1 (midnight), not Day 2. Example 2: If a shift starts at 10PM on Day 1, has a break at 1AM, resumes at 2AM, and continues until 6AM, then the Shift Start Date will be set to Day 1 (midnight), not Day 2. In both examples above, the start of the shift is the start time following the single longest gap in that particular shift (10PM). Thus, the Shift Start Date will be set to Day 1 (midnight). This data point is displayed as midnight because it is a Date object that can represent both data and time. The time portion cannot be hidden by default. The format can be changed in the column customizer for the table to only show the date, but it is not retained when different analysis results are shown in the same table. |
N/A | ||
Shift Start Date Time |
DateTime |
Start date time of the current shift. Both the date and the time will be accurate. Refer to the examples for Shift Start Date above, except the resulting value will also include the shift's start time in addition to the date (10PM on Day 1). |
N/A | ||
Shift Week of Month |
Int4 | Int value of the current week of the month. | N/A | ||
Shift Week of Year |
Int4 | Int value of the current week of the year. | N/A | ||
Shift Year |
Int4 | Int value of the current year. | N/A | ||
To Time Stamp |
DateTime | End time (minutes) of the current period (run time of the analysis). | minutes | ||
| General/Time |
|
|
|
||
Month Of Year |
Date |
The interval unit is one month for every month starting at the beginning of a year. Included in Sepasoft Versions:
|
months | ||
Top of Month |
Date |
Starting at the beginning of the month and time interval is a month. Included in Sepasoft Versions:
|
month | ||
Top of Day |
Date |
The time for every day starting at midnight (hours, minutes, and seconds equals 0). Included in Sepasoft Versions:
|
days | ||
Thirty Minute Interval |
Date | The time for every thirty minutes starting at the analysis begin date. | N/A | ||
| Fifteen Minute Interval | Date | The time for every fifteen minutes starting at the analysis begin date. | N/A | ||
Top of Hour Interval |
Date | The time for every hour starting at the top of the hour (minutes and seconds equals 0). | N/A | ||
Hour Interval |
Date | The time for every hour starting at the analysis begin date. | N/A | ||
Top of Minute Interval |
Date | The time for every minute starting at the top of the minute (seconds equals 0). | N/A | ||
Minute Interval |
Date | The time for every minute starting at the analysis begin date. | N/A | ||
Configurable Interval |
Date | The time for every X minutes starting at the analysis begin date. X is defined by the analysis setting 'Configurable Interval (Minutes)' or defaults to 15 minutes. | Configurable | ||
Batch Procedure Data Points
Analysis settings display:
- Batch ID List
- e-Signature authorization challenges
- Batch recipes
- Parameters at the different levels within a recipe
- Trace analysis when Track & Trace is implemented
Analysis Data Points include:
- Phase and phase parameters
- Unit Procedure parameters
- Equipment
- Batch and batch parameters
OEE Data Points
| Data Point | Data Type | Description | Units |
|---|---|---|---|
Elapsed Time |
Float8 | Elapsed Time of current operation. | minutes |
OEE |
Float8 | OEE value for selected period. | N/A |
Theoretical OEE |
Float8 | Theoretical overall OEE of a machine. This is a non-standard calculation. This is calculated by (OEE Quality * Theoretical OEE Availability * Theoretical OEE Performance). |
|
OEE General Count |
Long | Any count value other than infeed, outfeed, reject and waste value for the selected time period. | N/A |
OEE Infeed Count |
String | Equipment infeed count value for the selected period. | N/A |
OEE Infeed Count Equipment Path |
String | Infeed count tag collector path. | N/A |
OEE Outfeed Count |
String | Equipment outfeed count value for the selected period. | N/A |
OEE Outfeed Count Equipment Path |
String | Outfeed count tag collector path. | N/A |
OEE Theoretical Outfeed Standard Count |
String | The theoretical outfeed standard count if a line ran for the full scheduled time with no downtime. . This is a non-standard calculation. This value is calculated by (Standard Rate * Elapsed Time). |
|
OEE Reject Count |
Long | Equipment reject count value for the selected period. | N/A |
Outfeed Standard Count |
Float8 | Calculated expected outfeed based on standard rate and runtime. The runtime is based on the elapsed time, planned downtime and unplanned downtime. The Ignition schedules are not used when calculating the Outfeed Standard Count. | N/A |
Planned Downtime |
Float8 | Planned Downtime duration (Double) for selected period. | minutes |
Runtime |
Float8 | Runtime is the duration where the production item is in the run state. Runtime = Elapsed time - Downtime. | minutes |
Short Stop Time |
Float8 | Short stop duration (Double) for selected period. | minutes |
Standard Rate |
Float8 | Standard rate of a machine (per minute). | N/A |
Standard Rate for Hour |
Double | Standard rate of a machine (per hour). This depends on the amount of time covered by shift segments within a given hour, rather than a flat hourly rate. | N/A |
Target Changeover Time |
Float8 | Amount of time in minutes set for Target Changeover. See Changeover Duration for more details. | minutes |
Unplanned Downtime |
Float8 | Unplanned Downtime duration (Double) for selected period. | minutes |
OEE/Availability |
|||
| Is Short Stop | Boolean | True if current equipment state is consider a shortstop. See Short Stop Threshold for more details. | N/A |
| OEE Availability | Float8 | OEE Availability value for selected period. Runtime / (Elapsed Time - Planned Downtime) | N/A |
| Theoretical OEE Availability | Float8 | Theoretical OEE Availability of a machine. This is a non-standard calculation. This value is calculated by ((Elapsed Time - Unplanned Downtime) / Elapsed Time). |
|
OEE/Performance |
|||
| OEE Performance | Float8 | OEE Performance value for selected period. OEE Infeed Count / OEE Infeed Standard Count | N/A |
| Theoretical OEE Performance | Float8 | Theoretical OEE Performance of a machine. This is a non-standard calculation. This is calculated by (OEE Infeed Count / Theoretical Infeed Standard Count). |
|
| Theoretical Infeed Standard Count | Float8 |
The theoretical infeed standard count if a line ran for the full scheduled time with no downtime used in the Theoretical OEE Performance calculation. This is a non-standard calculation. This value is calculated by (Standard Rate * Elapsed Time * Package Count). |
|
| Infeed Standard Count | Float8 |
Calculated expected infeed based on standard rate, runtime, and package count. The runtime is based on the elapsed time, planned downtime and unplanned downtime. The Ignition schedules are not used when calculating the Infeed Standard Count. This value is calculated by Infeed standard count = Runtime * Rate * Package count. |
N/A |
OEE/Quality |
|||
|
OEE Quality |
Float8 | OEE Quality value for selected period. | N/A |
Settings & Changeover Data Points
| Data Point | Data Type | Description | Units |
|---|---|---|---|
| Recipe | |||
Active Recipe Name |
String | Name of the currently-active recipe. See Selecting and Downloading Recipes for details. | N/A |
Active Recipe UUID |
String | UUID of the currently-active recipe. See Selecting and Downloading Recipes for details. | N/A |
Recipe Enabled |
Boolean | If true, a recipe is currently active on the equipment. | N/A |
Recipe Scale |
Float8 | The scale value set for the selected recipe. | N/A |
Recipe Tracking UUID |
String | The unique identifier (UUID) for the current recipe. See the Recipe Tracking UUID property on the Recipe Variance Viewer page for details. | N/A |
Recipe Tracking UUID Sequence |
Integer | This number increments each time the Recipe UUID changes. It is useful for detecting when a new recipe has been selected. | N/A |
Recipe Type Code |
Integer |
Provides an integer instead of a string with the Recipe Type Name. Returns one of the following values:
|
N/A |
Recipe Type Name |
String |
The Recipe Type Name string provided for the selected recipe. Returns one of the following values:
|
N/A |
| Recipe Change Note | String | Version specific: 3.81.12 RC 1 and later 'Recipe Change Note' for the note that was entered with the recipe activation/deactivation | N/A |
| Recipe Change Note Entered By | Version specific: 3.81.12 RC 1 and later 'Recipe Change Note Entered By' for the 'changedBy' or 'user' field associated when the note was recorded. | ||
| Recipe/Time Stamp | |||
Active Recipe Time Stamp |
DateTime | The Time Stamp when the recipe was selected. | N/A |
Recipe Variance Time Stamp |
DateTime | The Time Stamp of the variance event in the selected recipe. It records the DateTime of any setpoint value change, regardless of whether it is away from the default setpoint value or back to it. | N/A |
| Recipe/Value | |||
Recipe From Value |
String | The previous value when a recipe has been modified. | N/A |
Recipe Set Point Description |
String | The Description text string provided for the Set Point in the modified recipe. | N/A |
Recipe Set Point Name |
String | The Name string provided for the Set Point in the modified recipe. | N/A |
Recipe Set Point UUID |
String | The UUID provided for the Set Point in the modified recipe. | N/A |
Recipe Set Point Units |
String | The Units text string provided for the Set Point in the modified recipe. | N/A |
Recipe Set Point Value |
String | The current value of the Set Point in the modified recipe. | N/A |
Recipe To Value |
String |
The current value when a recipe has been modified. |
N/A |
SPC Data Points
SPC definition and attribute data are added to live analysis in MES 3.0. This means that you can track samples by adding datapoints to a live analysis configuration via the the equipment manager -> location -> live analysis.
When ready to make a live analysis configuration simply choose the datapoints from the available list of datapoints under your sample definition/attribute. This is configurable in the same way as your regular live analysis i.e add your update rate, datapoint list, live analysis name etc. A new folder with your live analysis name will be added to MES tag browser.
| Data Point | Data Type | Description |
|
|---|---|---|---|
| SPC/Status | |||
Sample Coming Due |
Boolean | If true at the time of the row, a sample is/was coming due. |
|
Sample Due |
Boolean | If true at the time of the row, a sample is/was due. |
|
Sample Overdue |
Boolean | If true at the time of the row, a sample is/was overdue. |
|
Sample Waiting Approval |
Boolean | If true at the time of the row, a sample is/was waiting to be approved. |
|
Signal Out of Control |
Boolean | If true at the time of the row, any signal for any sample is/was out of control for the location. |
|
Sample Value Max |
Integer | The highest value among the results. |
|
Sample Value Min |
Integer | The lowest value among the results. |
|
Sample Value Mean |
Integer | The sum of all the resulting values divided by the number of results. |
|
Sample Value Median |
Integer | The value where half of the remaining resulting values are larger and half are smaller. For even numbers of values, the mid-point between the middle two values is returned. |
|
Sample Value Standard Deviation |
Integer | (calculated as Sample Standard Deviation) The square root of the average of the squared individual differences of each resulting value from the calculated mean. |
|
Sample Name |
String | Name of the sample. |
|
Any Time Interval |
String | Time interval |
|
Setting Values
The analysis results that are returned can be modified through the use of settings. Setting values provide a number of keywords as listed below.
Scripting with Setting Values
|
|
The format for entering the keywords: keyword1=True, keyword2=100.0, keyword3=10 Example : settings.setSettingValues('Unknown State as Unplanned Downtime = True,Descending Order = True') |

|
Settings like Enable Totalized Mode, Include Future, Last Values and Rollup Time span are meant for the Analysis Selector component only and not for Live Analysis. |
Historical Cache Key
When an analysis is run with an Historical Cache Key name in place, the cached data associated with that key will remain valid for the number of seconds set here.
|
|
The Cache Key string is used to create a folder on the file system of the server where the Ignition service is running. Any string values used must comply with the OS's character limitations for folder and file names. |
| Setting | Description | Use | Example | ||||
|---|---|---|---|---|---|---|---|
Collapse Empty SPC Rows |
Version 3.81.4 RC or later When true, rows that have no sample data will be removed from the result dataset. The resulting dataset also has all values moved to the last non-null row available. This defaults to False unless 'Last Values' setting is also true. Collapse Empty SPC Rows=False must not be added to live analysis as it will cause signals to evaluate incorrectly. |
Not valid for Live Analysis | Collapse Empty SPC Rows=True | ||||
Constrain Line State Duration to Row |
Constrains State Durations to the analysis row's time range. It is False by default. | All | Constrain Line State Duration to Row = True | ||||
Constrain Mode Duration to Row |
Constrains Mode Durations to the analysis row's time range. It is False by default. | All | Constrain Mode Duration to Row = True | ||||
Constrain State Duration to Row |
Constrains State Durations to the analysis row's time range. It is False by default. | All | Constrain State Duration to Row = True | ||||
Filter Comparison Date Format |
The Filter Comparison Date Format is the comparator for Filter By expressions that include dates. This setting does not format Analysis Output data of Date/Datetime types. Data display formatting should be done in a display layer (i.e. Chart, Table, etc.). The Filter Comparison Date Format comparator setting is via string, e.g. ' YYYY-MM-dd HH:mm:ss ', etc. | All | Filter Comparison Date Format = 2017-11-15 17:04:00 | ||||
Enable Totalized Mode |
This setting accumulates the count. Useful for charts where you wish to display the accumulated production count over time. | Not valid for Live Analysis | Enable Totalized Mode = True | ||||
Include Future |
Allows for count values to be calculated in the future. Useful for charts where you want to display target counts for future runs. | Not valid for Live Analysis | Include Future = True | ||||
Last Values |
Only the latest values are shown. | Not valid for Live Analysis | Last Values = True | ||||
OEE Availability Cap |
The maximum value calculated can be capped with this setting. | All | OEE Availability Cap = 1 | ||||
OEE Performance Cap |
The maximum value calculated can be capped with this setting. | All | OEE Performance Cap = 1 | ||||
OEE Quality Cap |
The maximum value calculated can be capped with this setting. | All | OEE Quality Cap = 1 | ||||
Rollup Time Span |
If the time (seconds) between downtime events is less than the rollup time and it is the same equipment and reason, then it will rollup the event into one row in the results and will increase the occurrence count. |
Not valid for Live Analysis | Rollup Time Span = 30 | ||||
Suppress Grouping Messages |
Suppresses any Analysis Messages that advise the user to add data points to the Group By list.
|
All | Suppress Grouping Messages = True | ||||
Row Limit |
The analysis can be limited to a certain number of rows. | All | Row Limit = 10 | ||||
Descending Order |
Analysis results will be ordered in descending order if set to True. | All | Descending Order = True | ||||
Include Children |
Specifies whether or not children of specified equipment are included in analysis calculations | All | Include Children = True | ||||
Unknown State as Unplanned Downtime |
Treat unknown states as unplanned downtime states. | All | Unknown State as Unplanned Downtime = True | ||||
Historical Cache Key |
Name of the key (string, no spaces or special characters) to point to a cached record of the analysis results. Once the analysis is run, a copy of the results is written to disk. If the same analysis is run again (with no changes to the filter properties), the results are pulled from the data file on disk instead of recalculated, to save processing time.
|
All | Historical Cache Key = Dec2019OEEAvailability | ||||
Cache Expiration |
Not in drop-down menu – must be typed into Name field.
When an analysis is run with an Historical Cache Key name in place, the cached data associated with that key will remain valid for the number of seconds set here. |
All | Cache Expiration = 43200 |

Sepasoft MES Module Suite